The 2024-2025 NBA season can be summarized as the year of a blockbuster trade, a serious setback for a young superstar, and an ageless LeBron. The shocking midseason trade that sent Luka Dončić to the Los Angeles Lakers in exchange for Anthony Davis was much more welcomed by Lakers fans than Dallas fans.Not surprisingly, Dončić quickly adapted to his new team, delivering amazing performances, including a 45-point game against his former team after fighting back tears during a touching pre-game video tribute. Meanwhile, Victor Wembanyama’s promising sophomore season was abruptly halted due to a diagnosis of deep vein thrombosis in his right shoulder.Despite averaging 24.3 points, 11 rebounds, and 3.8 blocks over 46 games, his health setback sidelined him for the remainder of the season and made him ineligible for the defensive player of the year title he was closing in on. And lastly, at 40 years old, LeBron James just had the best season that any 40-year-old ever has, averaging 24.4 points, 8.2 assists, and 7.8 rebounds per game.His latest showing has put the final nail in the “old LeBron > old Jordan” coffin, and since Jordan retired at 40, this is the first time we can compare the full year-by-year statistical histories of the two GOATs.
Before we get to all that, let’s name our MPP (Most Productive Player of the year) and also look at the players with the best stats per game and per minute. As a reminder, when I talk about “productivity”, there are three major metrics that I’ll discuss:
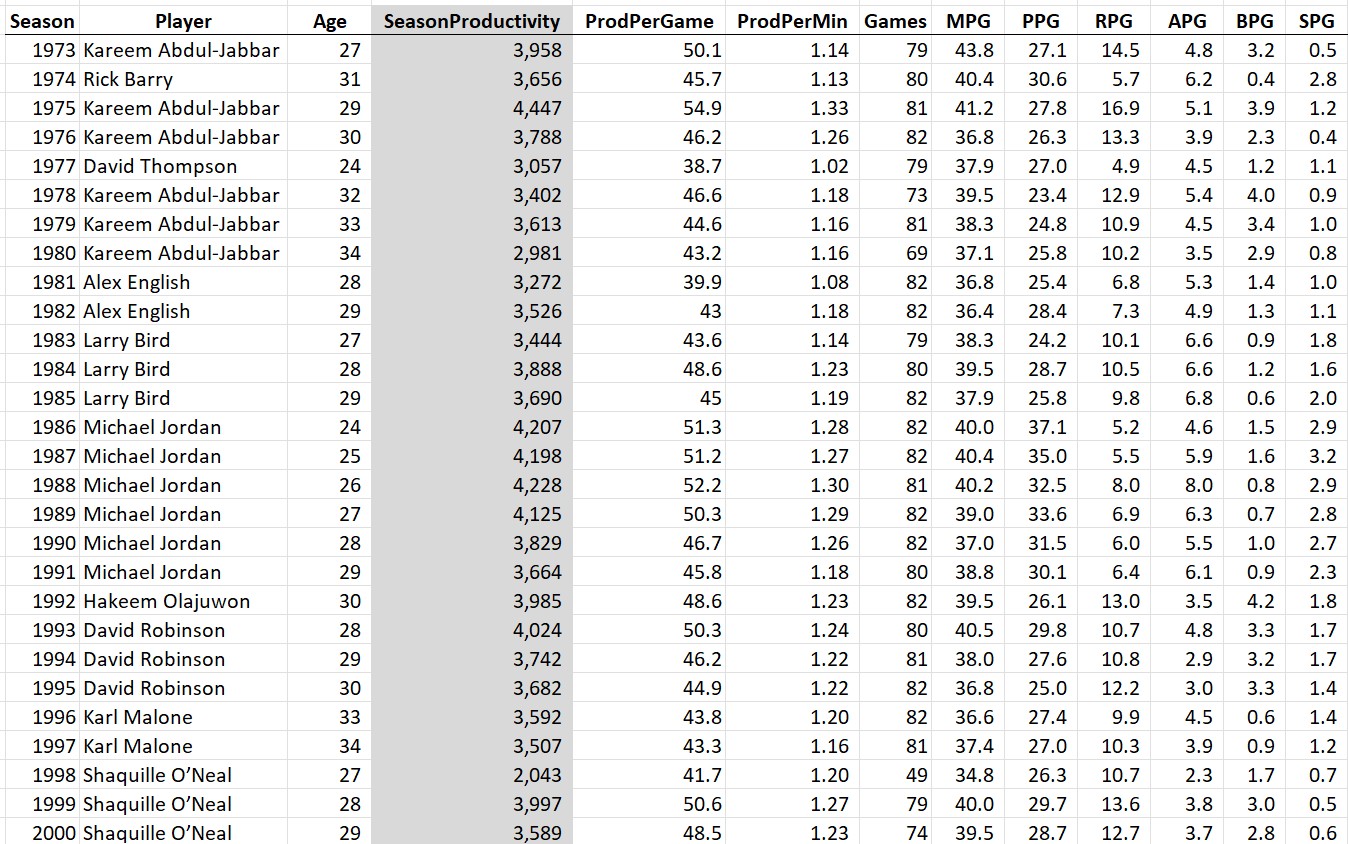
Total Productivity: the sum of a player’s points, rebounds, assists, steals, and blocks in a season. This is my go-to metric because it’s simple, it aligns with what players themselves are trying to accomplish during games, and it correlates best with ESPN’s all-time nba player rankings.
Productivity per Game: the average productivity per game played in a season. Another good way to compare players, but doesn’t factor in season durability and can be inflated by “load management.”
Productivity per Minute: as you might guess, the average productivity per minute played. On the surface, this stat makes a lot of sense since a player can only be productive while playing, however, as we will see later, this isn’t a great statistic to compare players across decades since due to a variety of changes to the game and playing decisions, today’s players dominate the all-time per-minute comparisons to a statistically improbable degree.
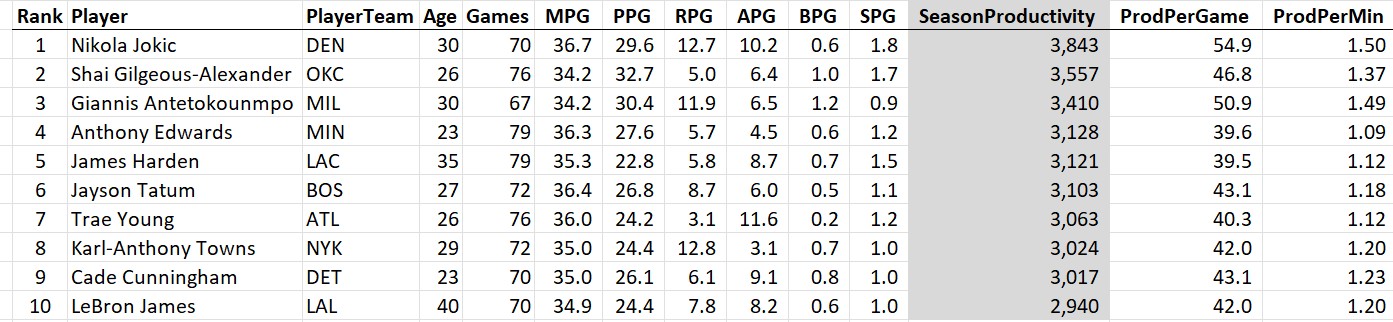
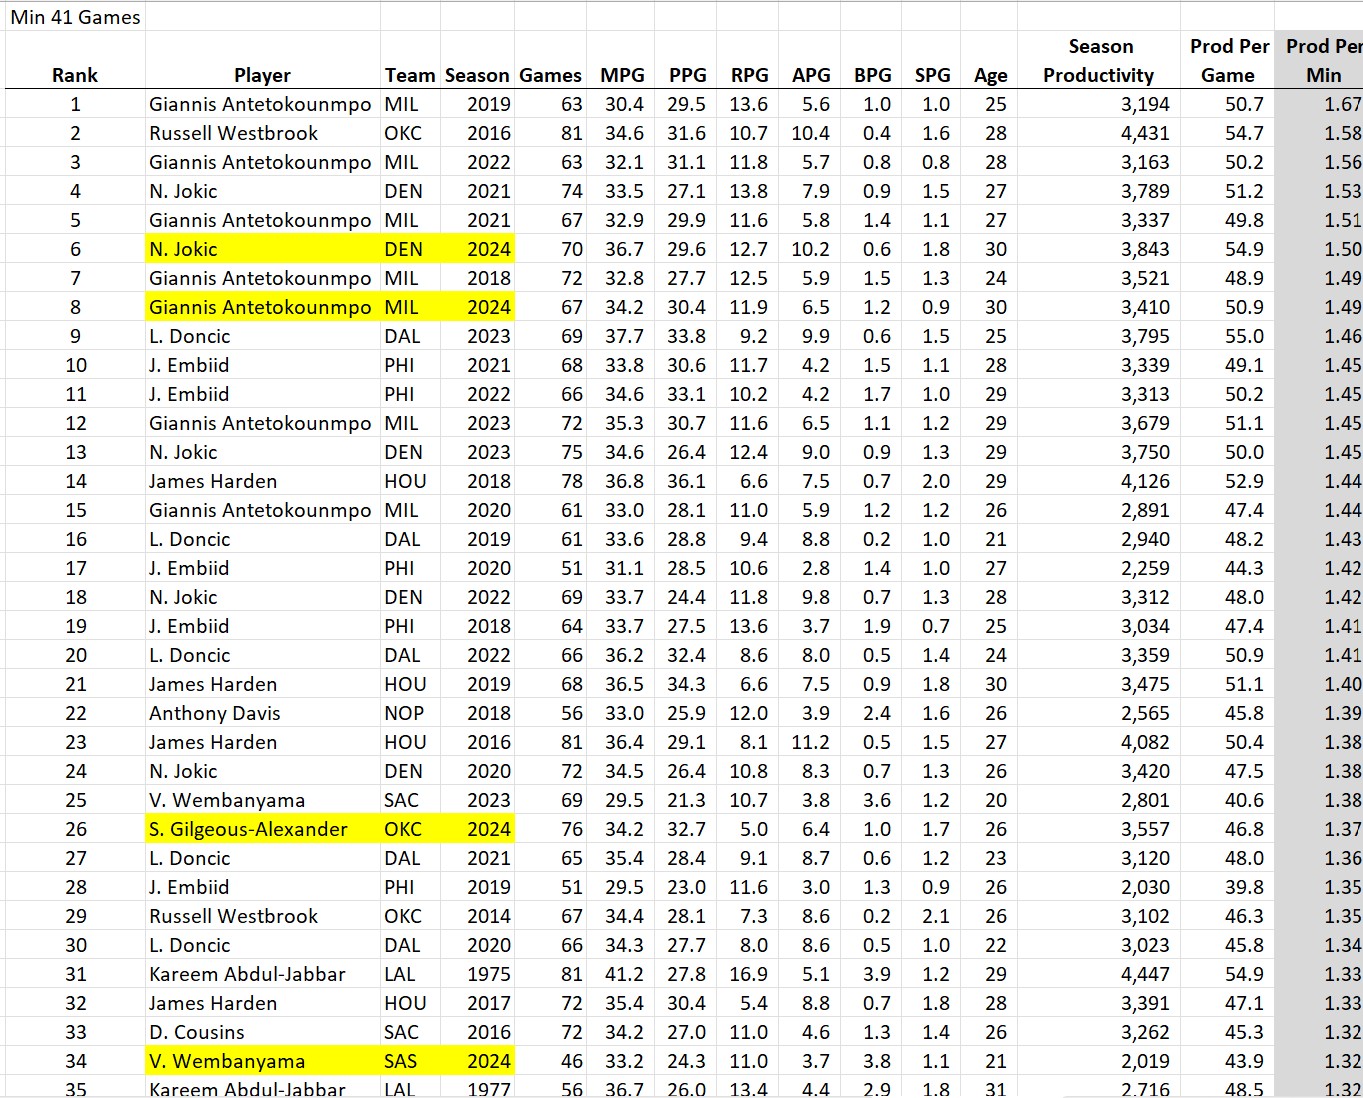
Here are the top 10 most productive players of the 2024-25 season:
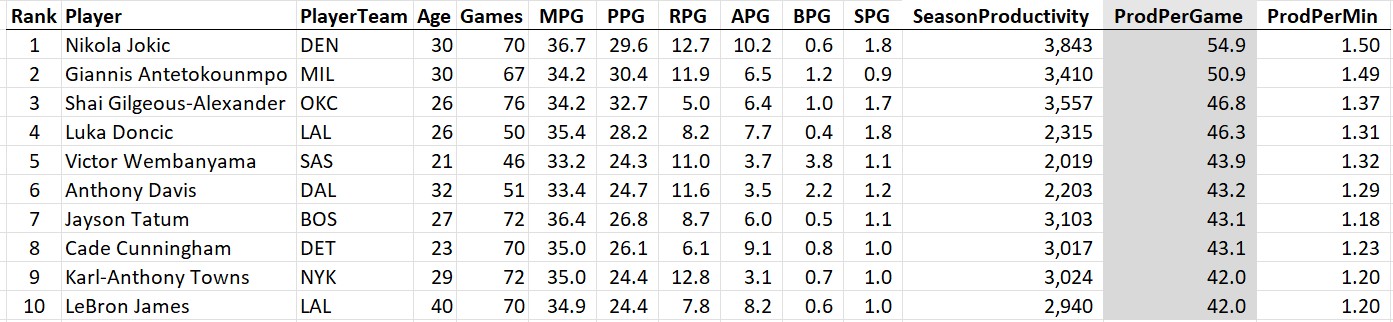
The most productive per game:
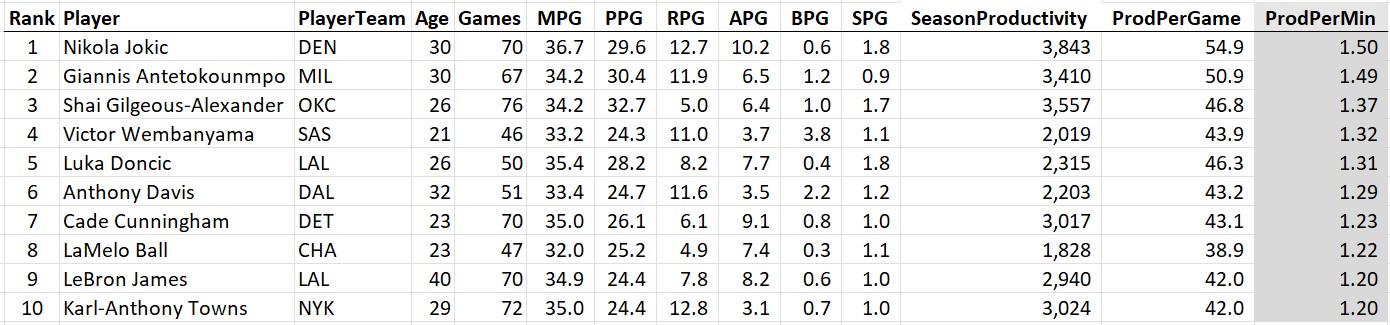
And the most productive per minute:
The takeaways: Jokic is #1 according to the raw stats and gets the MPP for the 2024-25 season (the third of his career). Notice that even Giannis Antetokounmpo ranked higher on two of the three metrics than the likely MVP Shai Gilgeous-Alexander (the Greek Freak came in behind SGA in total productivity due to playing 9 fewer games). Also, how is freaking LeBron James still in the top 10 at the age of 40?
Regarding the MVP Award, the best statistical argument I’ve seen in favor of SGA is this one from Nate Silver. First off, I agree that Shai is almost certainly on his way to the MVP due his team’s success. However, I have a few issues with the article. First, the majority of it is spent comparing SGA to the all-time great guards, even daring to compare his performance this year with His Airness. One thing that probably goes without saying is that in order to win the MVP, SGA doesn’t need to outperform great guards of the past, he needs to outperform Jokic. Silver does show that SGA slightly outperformed Jokic this year in a popular (but opaque) modern-day metric called EPM but doesn’t spend time explaining why that should be the metric of choice (it doesn’t inspire my confidence in it that according to EPM, my 10th most productive player of the year, LeBron James, is ranked at #56 just below Immanuel Quickly; either EPM’s ranking or my ranking is way off).
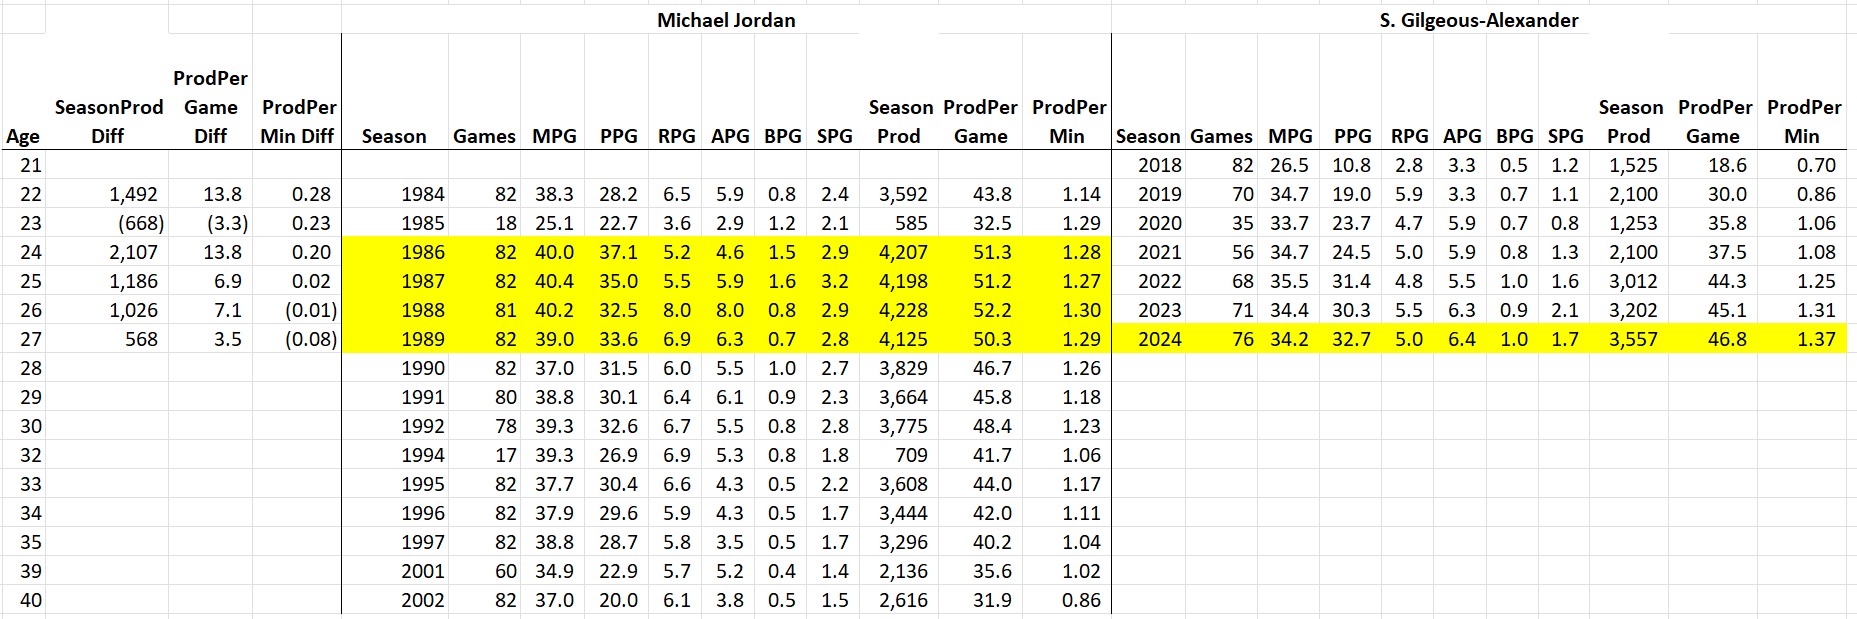
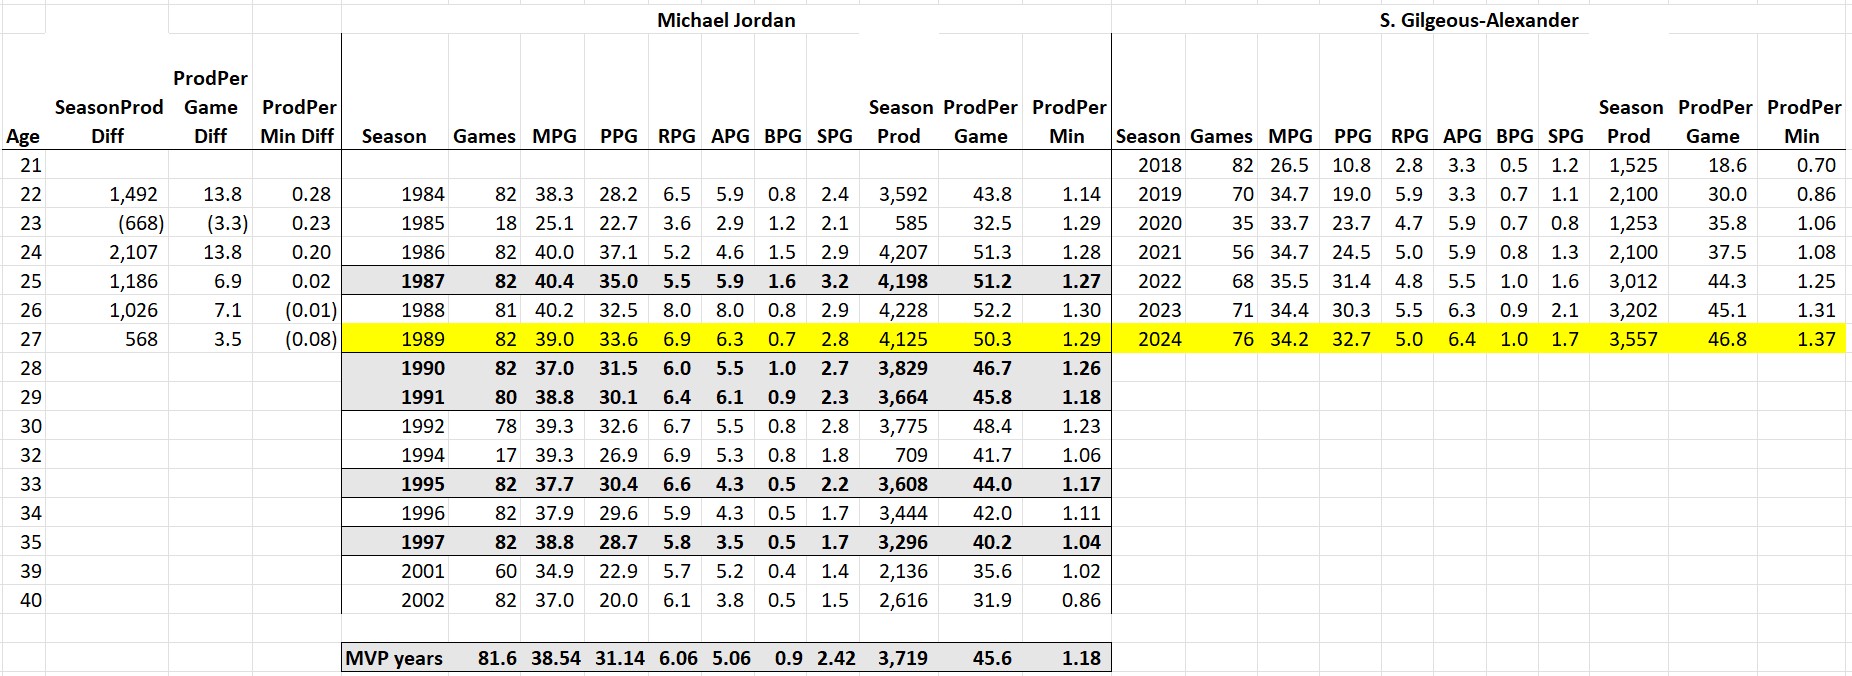
My bigger beef with Silver’s analysis is this chart showing that Shai’s 2024-25 season compares favorably with Jordan’s MVP years, implying that his per-game stats were better than MJ’s at his best. When I did my age-by-age comparison, not only did 27-year-old Shai (46.8 production per game) not out-perform 27-year-old MJ (50.3) on a per-game basis, SGA’s stellar year also wasn’t better than 26-year-old MJ (52.2), 25-year-old MJ (51.2), or 24-year-old MJ (51.3).
So what’s going on here? Notice the gray-highlighted stats for Jordan’s MVP years below:
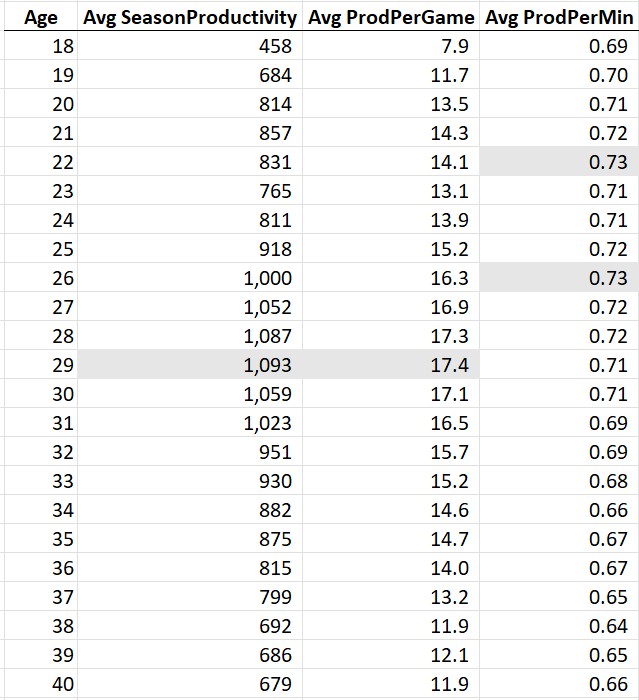
Four of MJ’s five MVP years came when he was older than SGA is now, including one when he was 35. I don’t think Nate Silver was being intentionally misleading (after all, he was arguing that SGA’s stats were sufficient for an MVP, not that he was statistically better than Jordan). But I also don’t approve — the best way to compare players is to control for age. The sad fact is that it’s all downhill statistically once players reach their 30s:
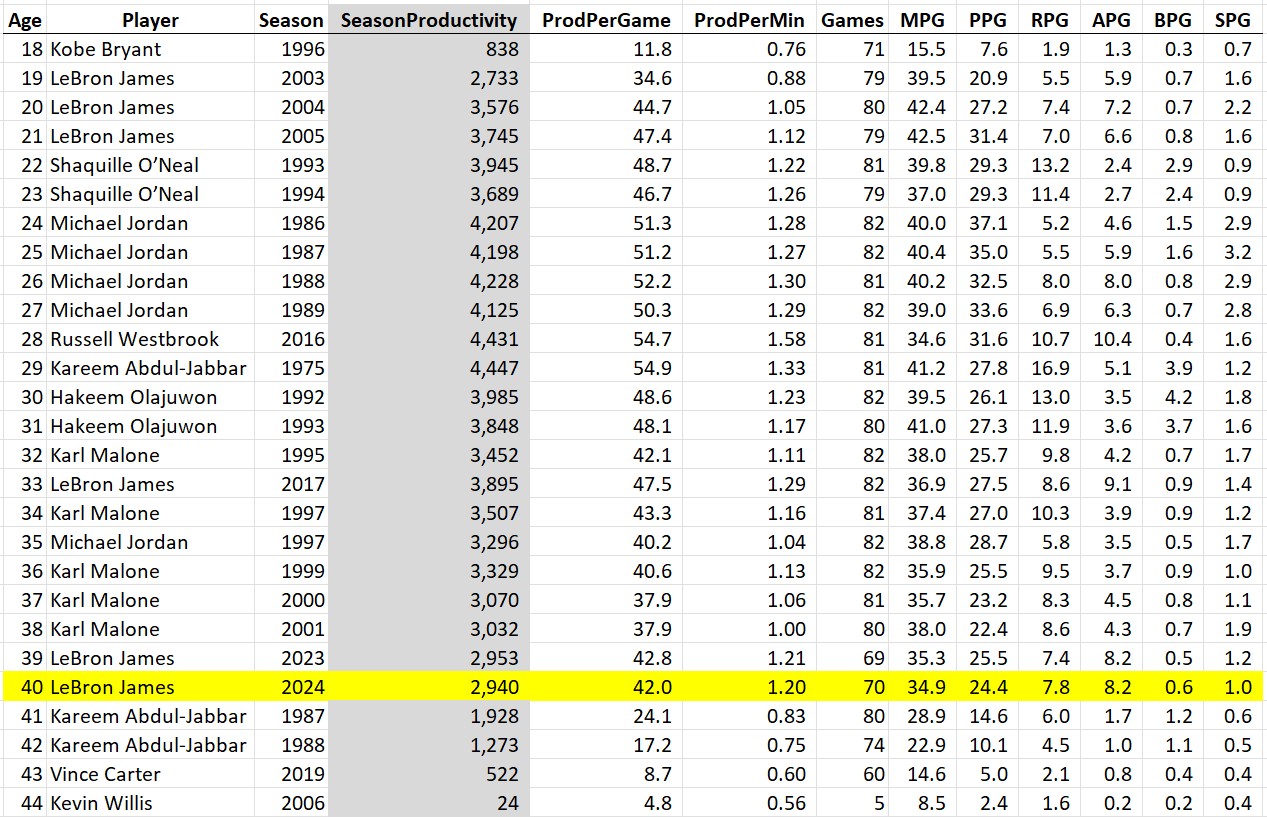
Which brings us to LeBron. He’s dunking on father time. His top-10 season productivity of 2940 mentioned at the beginning of this article is 4.33x as much as the historical average for nba 40-year-olds shown above. And as this past season just replaced Jordan’s final year in the list of best-ever performances by age, the debate about old Jordan vs. old LeBron is officially settled, if it wasn’t already:
Also, looking at Kareem’s 40+ year productivity numbers, it’s clear that if LeBron stays healthy, he will be setting “best ever at age x” records as long as he chooses to play.
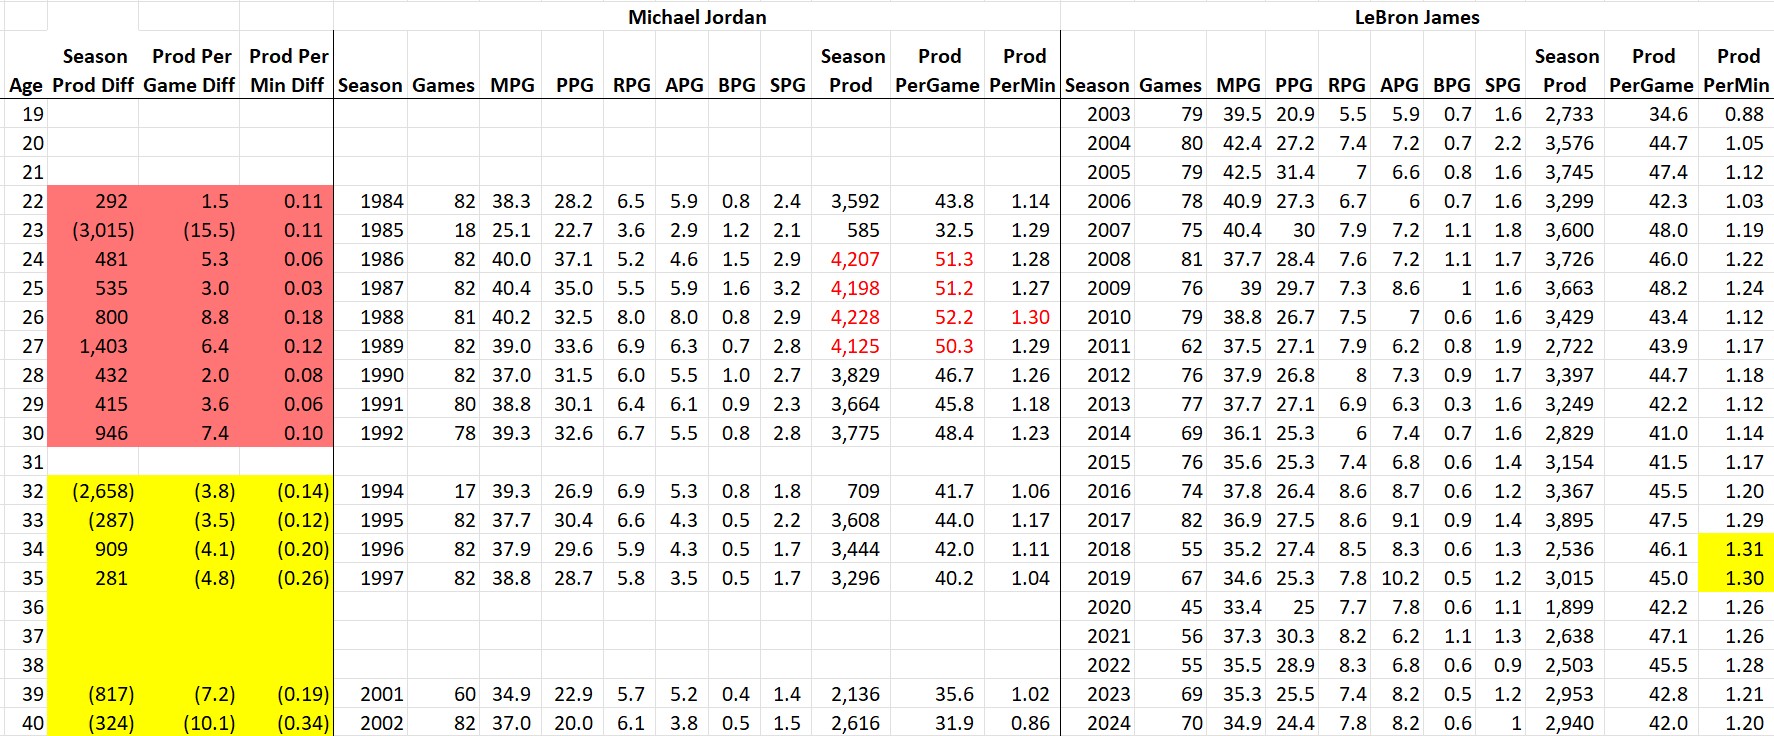
Since Jordan’s final season was at age 40, we can for the first time (and last time, I promise) compare his entire career to LeBron’s age vs. age.
As discussed last year, there is a clear pre-baseball (red) / post-baseball (gold) story. LeBron never reached the statistical heights of MJ’s mid-20s (4,000+ season productivity or 50+ per-game productivity). The one exception being that in his mid-30s(!), LeBron did match or surpass MJ’s best per-minute productivity.
So, if you’re like me and consider the GOAT to be the one who most closely approached God-mode omnipotence on the basketball court, MJ is the One. However, if you believe God’s most important feature is immortality, then LeBron is your guy. His consistency is crazy — consider the fact that his per-game statistical output at age 40 is only slightly lower than it was at age 22.
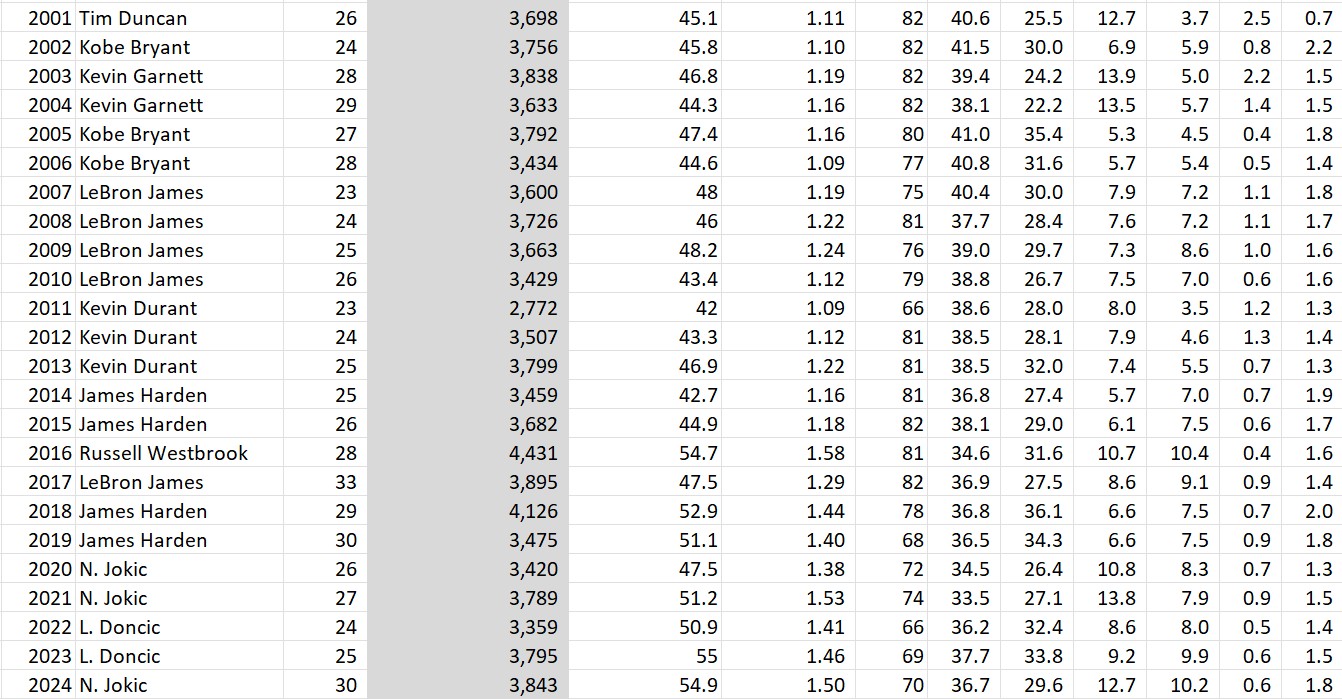
Let’s get back to this year’s stats and put them in historical context. As mentioned earlier, Jokic is my MPP, ending Luka Magic’s two-year win streak. Here are all of the historical MPPs in my dataset:
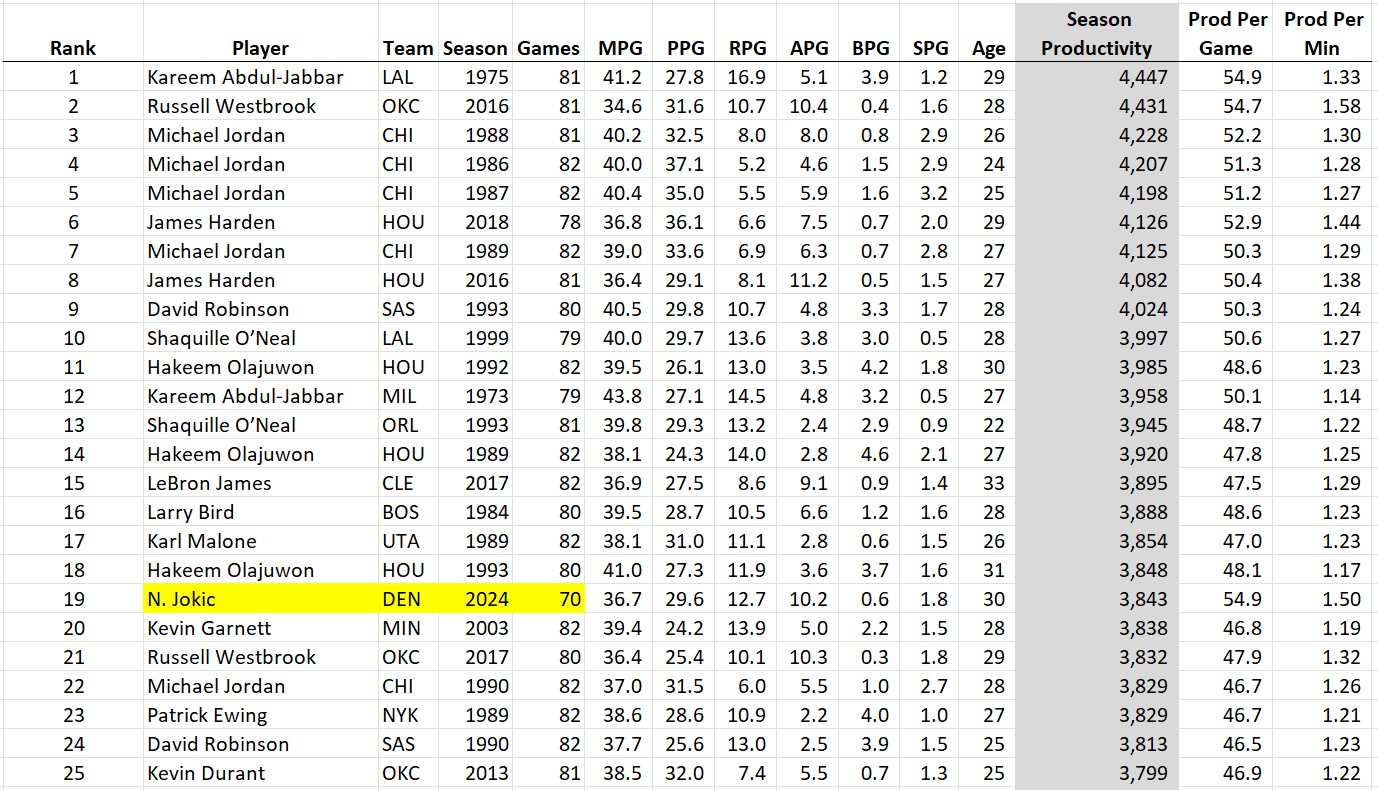
Jokic put up videogame stats this season, so how does it compare to the all-time best seasons?
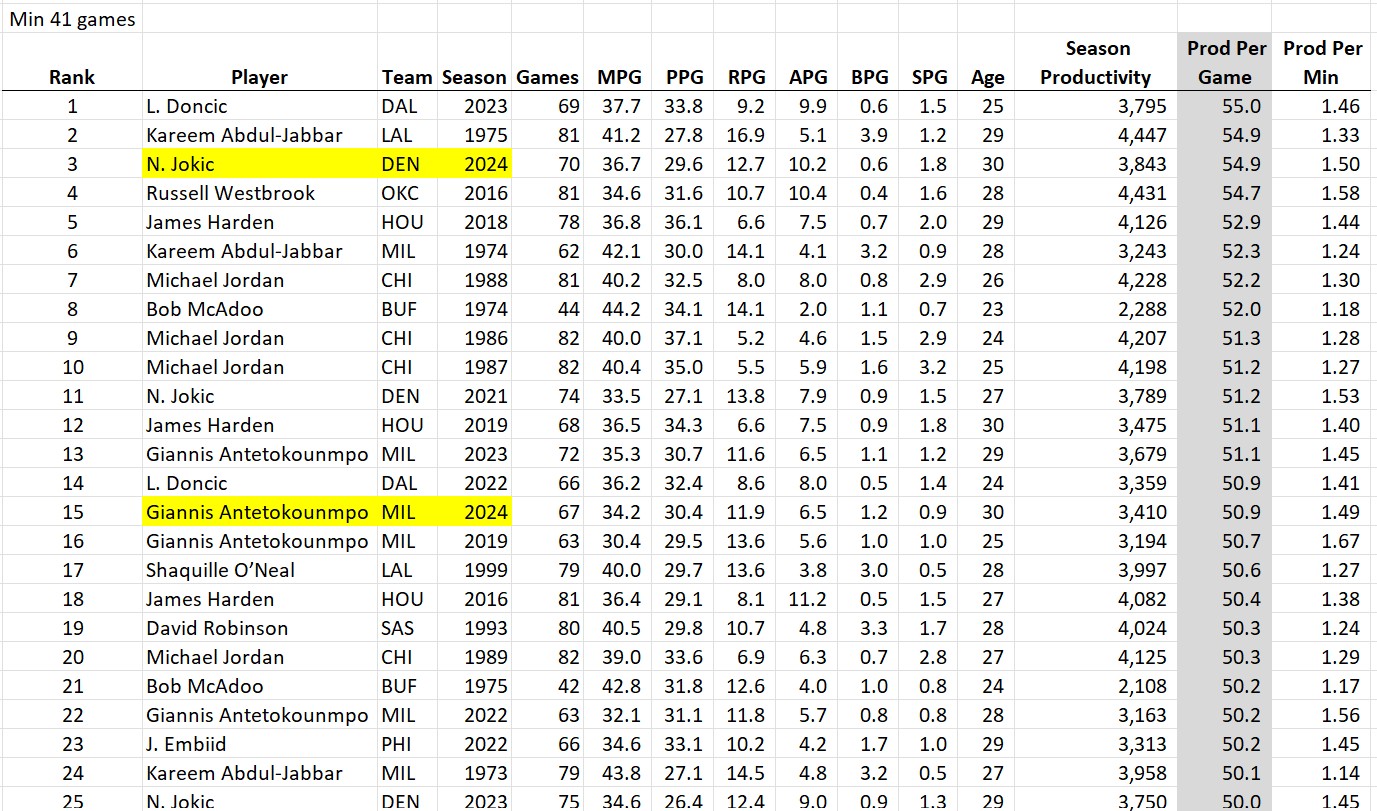
While ranking 19th might seem low for such an epic season, keep in mind that this stat is “total season productivity” and he only played 70 games. The only one in the top 50 to play fewer games was Luka last year (3795 in 69 games). How about “productivity per game”?
By this metric, Jokic just turned in the 3rd best season in the modern era (honorable mention to Giannis Antetokounmpo who notched the 15th best season on the list). And per minute played?
I extended this list further than the top 25 to show how many of this year’s players posted stats on this all-time list (Luka at 1.31 and Anthony Davis at 1.29 also cracked the top 50). At the time Wemby was taken out of the lineup due to his condition, his per-minute productivity was just a notch below the likely MVP! Something else should strike you about this list: where are all the old-timers? There is something dramatically different about the NBA these days, because there are only two players from before 2014 anywhere in the top 50: Kareem Abdul-Jabbar in the 1970s and Michael Jordan in the 1980s.
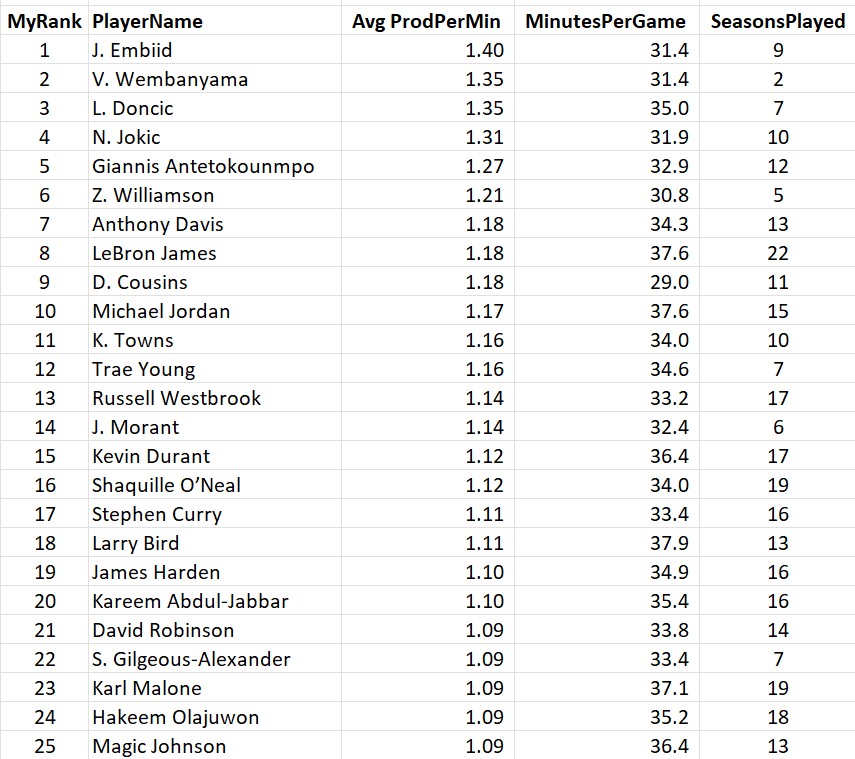
In fact, if you look at the top 25 players all-time, in terms of average “per minute productivity”, most of the players are still currently playing (Jordan is the only retired player in the top 10)!
This is a surprising list. Who would’ve guessed that Joel Embiid has the highest productivity per minute in a league with Luka and Jokic? And Wemby is #2, also ahead of both of them?? This really shows the incredible potential of the Alien if he can come back healthy next year. And speaking of staying healthy: Zion is currently ahead of LeBron, just beneath the Greek Freak. Imagine their future impact if Zion and Wemby could somehow inherit LeBron’s durability.
Here’s the current list of all-time highest average productivity per game (and yes, I know it’s not fair to mix old-time players in a list with current players who are unlikely to be able to maintain their productivity until retirement, but it’s fun):
So far, Luka, LeBron, and Embiid are ahead of Jordan-level per-game averages with Wemby and Jokic just behind. Given the fact that MJ had the best-ever final season, it will be tough for them to stay at the top of this list, but keep your eyes on Luka, Embiid, and Wemby, whose best seasons may still be ahead.
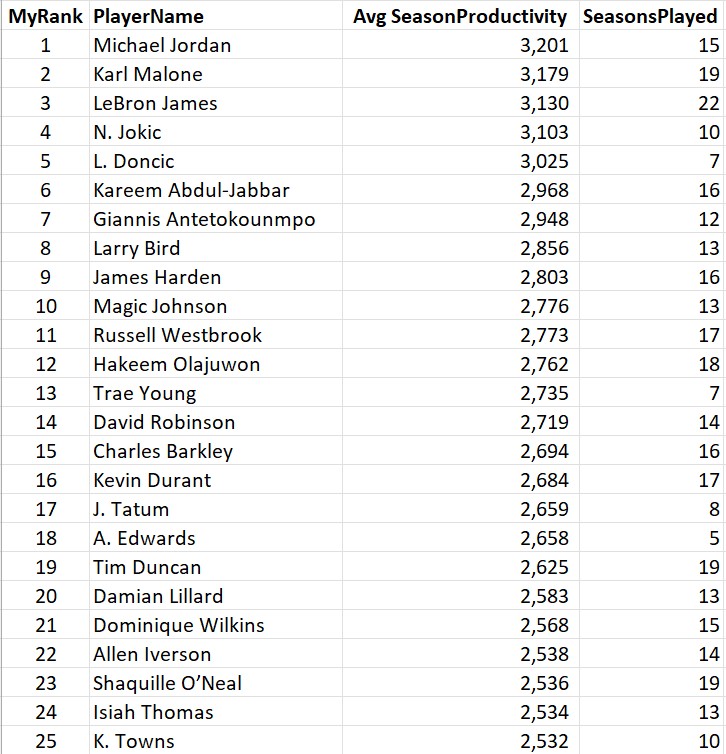
One final list for you, the all-time leaders in average productivity per season:
Jordan tops this one thanks to his many 82-game seasons and Malone over-achieves at #2 thanks to his durability and 100,000 free throws (is this the one all-time record LeBron will never be able to capture?). You’ve gotta love this list when the three most common names that enter GOAT discussions are in the top 6 (Jabbar would be higher if I had stats for his entire career) along with the two biggest stars in today’s NBA.
Well, that’s it for now, I hope you enjoyed this year’s statistical wrap-up. Let me know what other numbers I should crunch!
(If you still haven’t had enough of this, I provide ChatGPT’s “Deep Research” on the statistical GOATs of the NBA. (Sorry about the broken image links, not sure what happened there.) Enjoy!)
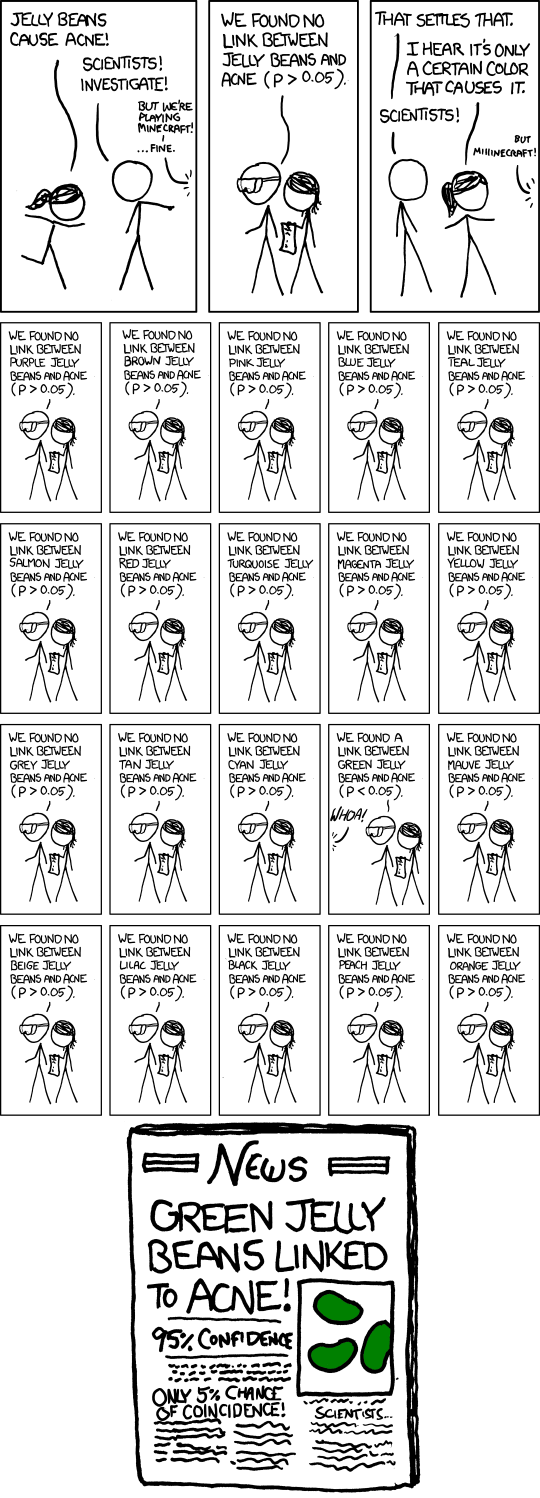
In “Distrust – Big Data, Data Torturing, and the Assault on Science,” Gary Smith discusses the ills plaguing science and the public’s trust in it. The central theme is that science and scientific credibility are under attack on three fronts: internet disinformation, p-hacking, and HARKing (Hypothesizing After the Results are Known). These threats work together to compromise the reliability of scientific studies and to exacerbate the dwindling trust in its findings.
The internet has long been a double-edged sword; while it provides a platform for free expression and the collection of human knowledge, it’s also a petri dish for disinformation. Smith describes how falsehoods proliferate online, often accelerated by algorithms designed to prioritize engagement over accuracy. This phenomenon is particularly dangerous when tackling real-world challenges like COVID-19. Disinformation has led to widespread skepticism about science-backed interventions like vaccines. In this age of “fake news,” public trust in mass media has also taken a hit.
Real Science, Real Results
Gary Smith lauds the success of mRNA vaccines—a stellar example of science working as it should. With a 95% drop in infections reported in randomized trials, the vaccines developed by Pfizer-BioNTech and Moderna have proven to be nothing short of miraculous. Smith points out that these vaccines’ effectiveness is supported by solid data, contrasting the unsubstantiated claims made about hydroxychloroquine and ivermectin. This distinction between evidence-based medicine and wishful thinking underlines the importance of critical thinking and analytical rigor.
AI: A Story of Broken Promises
As usual, Smith brings a dose of reality to the overly optimistic world of artificial intelligence. After IBM’s Watson stole the spotlight by winning Jeopardy!, it was hailed as a future game-changer in healthcare diagnostics. However, the reality has been far less revolutionary. Smith dissects this failure, highlighting the critical weaknesses of AI. AI is not the impending super-intelligence it is often promoted to be, which is critical to understand as we navigate the ever-evolving landscape of AI technology.
[Side note: Gary and I have good-natured debates about the importance of ChatGPT. He argues that chatbots are “B.S. Generators” and that’s actually a fairly apt characterization. I used to work with a software developer who admitted that when he didn’t know the answer to a question the project manager was asking him, he would “blast him with bullshit, just BLAST him!” and by that, he meant that he’d just overwhelm him with technical-sounding jargon until he went away confused. Assuming that he wasn’t just choosing words at random, the technical jargon he blasted the manager with was probably something he’d heard or read somewhere. Sounds a bit like ChatGPT, doesn’t it?
However, there’s a difference. ChatGPT is using our prompts to find the most appropriate (and surprisingly grammatically correct) response. As Smith points out, chatbots don’t know what words mean or what the world is like, they’re just finding patterns in their training data and parroting back to us what people usually say. However, it’s not just nonsense; you could say that it’s giving us glimpses of the sum of human knowledge available as of 2021! Of course, information can be wrong on the internet, but ChatGPT is basically a linguistic interface that boils the entire web down to the essence of what you’re probably looking for. Contrast this with Google’s endless list of possibly helpful links or Wikipedia’s firehose of overly technical information… have fun trying to extract the answer for yourself! I think ChatGPT is revolutionary. It’s not actually intelligent, but it will save us countless hours and teach us things in the most efficient way possible: through question and answer sessions.
Regarding the downside of chatbot “hallucinations”, guess what: you should always be skeptical of what you read. If you Google the age of the universe right now, it gives you the speculations of a recent paper instead of the scientific consensus. Sometimes, when it’s important, you need to verify information. Chatbots are no better or worse than what people have said about your topic of interest on the internet. Most of the time, the “wisdom of the crowds” is fine. And it’s still up to you to figure out when it’s not.]
Smith often says that the danger is not that AI will get smarter than us, but that people will think AI is smarter than us and rely on it for things they shouldn’t. Smith uses the entertaining BABEL automatic essay generator as a cautionary tale about relying on algorithms. BABEL basically cranks out random nonsense, but uses a lot of big words, and gets scored highly by automated essay graders (yes, automated graders can be “blasted with B.S.”). It’s an amusing yet stark reminder that while technology has come a long way, it can still be gamed or manipulated. Smith uses this example to show the pitfall of over-reliance on AI for tasks that require nuanced understanding, an essential lesson for educators, data scientists, and policymakers alike.
The Disturbing Trend of Retracted Studies
Smith doesn’t shy away from criticizing the scientific community itself, particularly the increasing rate of retracted papers. The integrity of the scientific process needs an upgrade. Retractions can shake public trust and, as Smith notes, signal a deeper issue with ‘p-hacking’ and ‘HARKing.’ These practices distort data and hypotheses to manufacture significance, undermining the credibility of entire fields of research. Smith exposes the incentives that lead to shoddy peer reviews and phony journals.
The concluding chapter, “Restoring the Luster of Science,” is a manifesto for renewing public trust in science. Smith exposes the downsides of “filter bubbles,” where algorithms shape our realities by reinforcing existing beliefs and biases. He also wrestles with the ethical implications of regulating speech to combat disinformation without infringing on civil liberties. This chapter serves as a summary of the book’s overarching themes and offers a pragmatic way forward for educators and policymakers.
I was particularly happy to see his last three recommended actions to help restore the luster of science:
Courses in statistical literacy and reasoning should be an integral part of school curricula and made available online, too.
Statistics courses in all disciplines should include substantial discussion of Bayesian methods.
Statistics courses in all disciplines should include substantial discussion of p-hacking and HARKing.
I couldn’t agree more and in fact am currently working with Julia Koschinsky at the University of Chicago on designing a course that takes up the challenge: “Becoming a Data Scientist in the Age of AI – Developing Critical Skills Beyond Chatbots”.
Missed Opportunities
The book does leave a couple stones unturned. Smith understandably avoided the more thorny issues surrounding social media’s premature suppression of the COVID “lab leak” hypothesis (it got muddled up with the “intentional bioweapon” conspiracy theory) which could have added a nuanced layer to the discussion about regulating misinformation for public safety. The topic has been the subject of significant controversy and debate, particularly because it touches on complex issues involving science and politics. (Btw, the most entertaining defense of the hypothesis was undoubtedly this one by Jon Stewart).
The challenges that tech companies face with real-time content moderation, especially when dealing with rapidly evolving scientific matters where the truth is not easily discernable, are significant. There are ethical dilemmas related to freedom of speech versus public safety, debates about the responsibility of tech companies in moderating content, and questions about how we navigate “the truth” in an age overwhelmed by information and misinformation alike. There are no easy answers here, but it would be interesting to read how a thinker like Smith would navigate these murky waters.
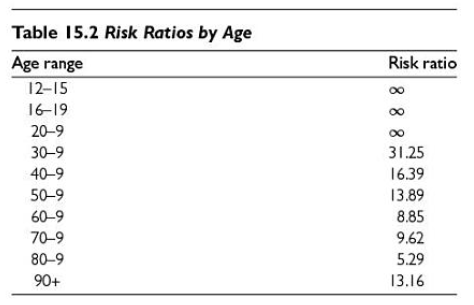
I also think the book missed a golden educational moment concerning reported vaccine efficacy…
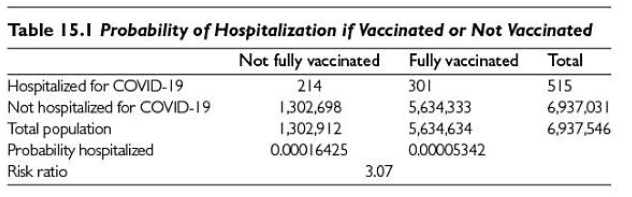
Look closely at Smith’s tables below…
You may wonder how an overall odds risk ratio can be 3.07 when none of the risk ratios are that low when grouped by age!
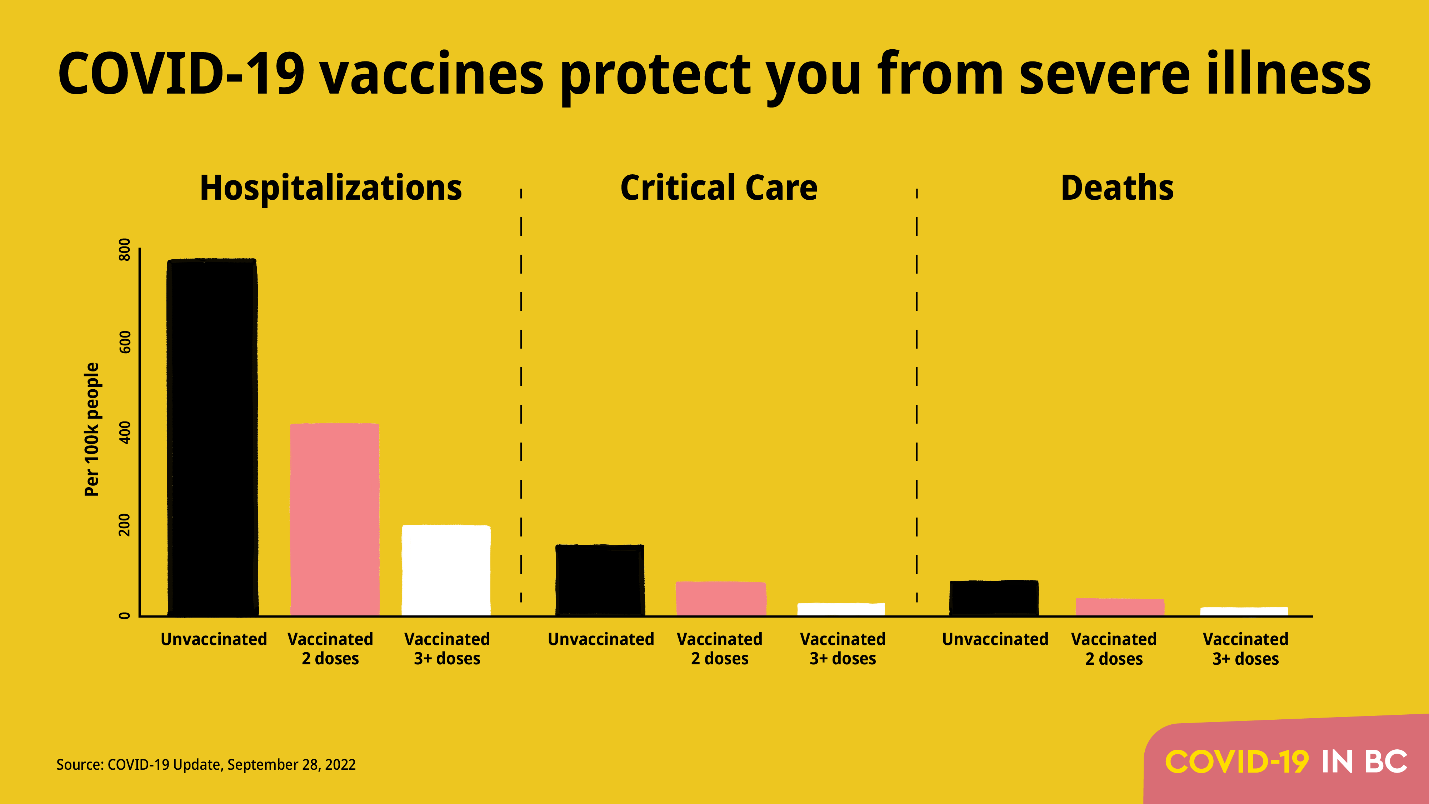
Smith would instantly know the answer, but most of us wouldn’t. The majority of comparisons we see between vaccinated and unvaccinated look more like his first chart, with a 2-4x benefit of vaccination…
It’s a straight-forward comparison of the probability of hospitalization for vaccinated and unvaccinated people? What could be wrong with that?
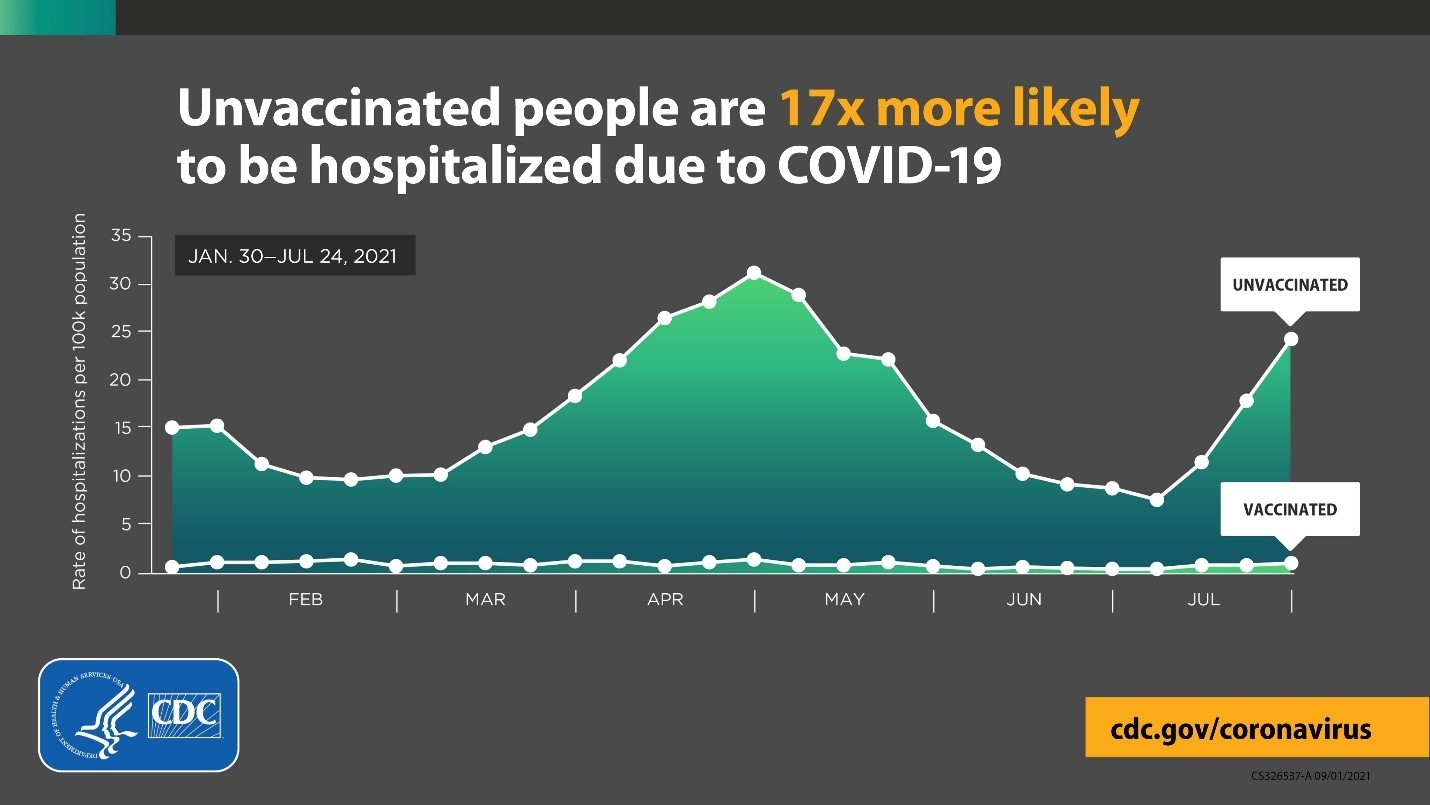
It turns out that it’s very misleading to directly compare vaccinated people vs. unvaccinated people, because it’s not an apples to apples comparison! I’ll take a wild guess and say that the population of vaccinated people are more concerned about catching COVID-19. Specifically, they are more likely to be elderly, overweight, or have pre-existing conditions. That means that these simple comparisons between the two groups are greatly understating the benefit of vaccination! The reality (when controlling for age, as in Smith’s second chart) is more like this…
The CDC did their best to control for all of the variables, but even their analysis is probably understating the benefit, given the 19x improvement shown in the randomized controlled trials.
Conclusion
Gary Smith’s “Distrust – Big Data, Data Torturing, and the Assault on Science” is a timely, critical examination of the various threats to scientific integrity and public trust. It serves as both a warning and a guide, tackling complicated issues with nuance and depth. For anyone interested in science, data science, education, or public policy, this book is an invaluable resource for understanding the modern landscape of disinformation, scientific misdeeds, and the quest for truth.
By now you’ve probably seen the viral video of Steph Curry draining 105 3-pointers in a row during practice. You’re probably thinking “that guy can shoot well!”, but it’s a lot more than that. Historically, he’s shot an amazing 65% during the NBA 3-point shootout competition, but let’s be generous and say that his 3-point shooting percentage during practice is 80%. To put that in perspective, there are only a few hundred NBA players in history who have a career free throw percentage that high. So, what are the chances, you ask, that someone who shoots with an accuracy of 80% would make 105 in a row? About 1 in 15 billion. Yeah, it was a lucky streak.
Now, there is another explanation which traditionally hasn’t been taken seriously by people in the data wonk profession: the Hot Hand. It’s even been called the Hot Hand Fallacy. There have been several studies concluding that there is no evidence that those of us who feel like we’re on a “hot streak” aren’t deluding ourselves and being fooled by randomness. They have a point that randomness is much streakier than we expect, but I’ve always thought that if we had a controlled environment, the evidence for the Hot Hand would become clear (and not just because I somehow made 32 free throws in a row once). After examining the NBA Three-Point Shootout data, Gary Smith and I showed in our latest book that, given the relatively few contests in history, the mere existence of Craig Hodges 1991 streak of 19 consecutive baskets provides strong evidence in favor of the hot hand hypothesis.
Now, cherry-picking extreme examples is normally not a good way to gather statistical evidence. However, it can be considered compelling if you appropriately take into account how large the number of events there were from which you were cherry-picking. In the Hodges case, this means looking at how many participants there have been in the history of the NBA Three-Point Shootout. There simply haven’t been enough shooters in the contest’s history to expect a shooting streak like that if there’s no such thing as a Hot Hand!
Some other NBA news today indirectly provided another reason to believe in the Hot Hand. Curry just broke the Warriors franchise record for most consecutive free throws made in a row: 61. The NBA all-time record is 97 straight. That’s an amazing number, but how can the all-time streak of consecutive makes from 15 feet be smaller than the number of consecutive makes on Curry’s highlight reel of 3-pointers, more than seven feet further away from the basket?
Once again, I argue that the Hot Hand is the answer. In the NBA, free throws are usually shot in pairs, so players don’t have a chance to settle in and establish a hot streak. Shooting free throws is more in line with the statisticians assumption that each shot is an independent event; whether or not you made your last free throw 10 minutes ago doesn’t affect the likelihood that you’ll make the free throw you’re shooting now.
In order to decide whether or not Curry’s videotaped shooting streak is evidence that the Hot Hand is real, we need to account for the universe of attempts from which his 3-point shooting streak was cherry-picked. Let’s say there are 500 trillion basketball players in the world and that they all shoot 50% from behind the 3-point line (the NBA average is 35%). Now, let’s assume that they’ve each made a videotaped attempt at Curry’s feat once per day for the 13.8 billion year history of the universe (never mind that 3-pointers were invented only 40 years ago). How many times would you expect to see Curry’s feat replicated? About 0.00006 times. Of course, that’s if you assume the Hot Hand is a fallacy.
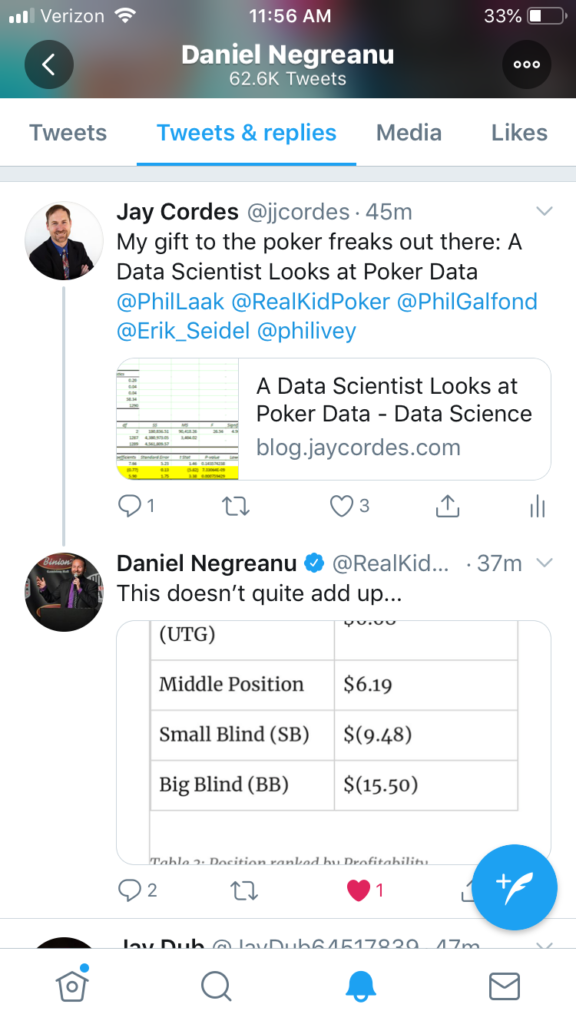
Okay, so now that the president has shown us that COVID-19 is a piece of cake as long as you have a tiger blood transfusion at the ready, we can focus on more important things: I’m honored to say that poker legend Daniel Negreanu glanced at my last blog entry and … said that it didn’t add up.
Figure 1: That is correct, sir. They don’t add up, and it’s my bad for making it look like they should.
I displayed the total stats by position, summarizing the data to just show the aggregates without any filtering or funny stuff. Nothing to explain, right? It’s the total profitability for each of the positions at the 6-max tables.
The problem is, as my friend pointed out, “shouldn’t you use only the data for full tables? Apples and oranges, otherwise.” What do you think? Here’s my original table, which is the total profit for each position divided by the total hands played from each position…
Position
Success(profit per hand)
Button
$11.09
Cutoff
$6.85
Under the Gun (UTG)
$6.68
Middle Position
$6.19
Small Blind (SB)
$(9.48)
Big Blind (BB)
$(15.50)
Table 1: The original table of profit by position. Do you see what Daniel saw?
If you’re assuming that each position was played the same number of times, there’s a big problem: the numbers add up to an average profit greater than zero! Poker sites don’t run for free, and they certainly don’t give away more money than they take in. The numbers aren’t wrong, but an assumption is; every hand dealt has a big blind, but not every hand played has an Under the Gun player (there are often seats empty at the table). Allow me to present a new version of the table with profit by position only when the table is full:
Position
Success(profit per hand)
Button
$10.92
Cutoff
$7.53
Under the Gun (UTG)
$6.54
Middle Position
$5.17
Small Blind (SB)
$(11.03)
Big Blind (BB)
$(20.21)
Table 2: Better table. Profit by position WHEN ALL 6 SEATS ARE TAKEN
Even though this table is based on less data, it lines up better with expectations. If you add up the numbers now, you get -$1.07, which is the average rake (it ranges from $0 to $3). The ranking of the seats by profitability is still the same, even with that odd quirk of UTG being more profitable than the middle position, despite being a worse position. However, you’ll notice that the increase in profitability is smoother. The dealer position is no longer so unusually profitable (the dealer’s relative advantage evidently grows as the number of opponents decreases) while all of the other non-blind positions are about the same. The takeaway lesson is this: make sure you’re showing people what they’re expecting; don’t just show aggregate numbers for the entire dataset as a matter of principle.
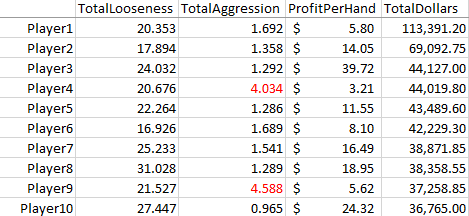
Anyway, recall that last time, we found that, overall, the top 10 players (by total profit) were tighter and more aggressive than the bottom 10 players. Let’s look more closely at how the top 10 vs. the bottom 10 played when the tables were full. The top players pocketed a total of $508,000 ($8.35 per hand), while the bottom players lost $338,000 (-$10.84 per hand).
Another thing you’d expect to see from good players is a better ability to manage “tilt”, which is when people’s emotions get out of control and they’re unable to continue playing their “A game” after a big loss. Since we’re looking at data for $50 big blind tables, let’s call a big loss one that exceeds $1000. This happened less than 1% of the time for the biggest winners, so it’s pretty rare.
According to a paper co-authored by my professor buddy Gary Smith, “…experienced poker players typically change their style of play after winning or losing a big pot—most notably, playing less cautiously after a big loss, evidently hoping for lucky cards that will erase their loss.”
As a group, the biggest winners played 20.7% of their hands in the following round (6 hands dealt) after a big loss, while the biggest losers played 35.3%! That’s a dramatic difference, especially when you consider that the looseness in general (not preceded by big wins or losses) for these groups was 21.1% and 28.1%, so the top players displayed no tilt at all, while the bottom players went a bit crazy. After a big loss, the loss per hand for the bottom players more than doubled ($-9.43 to $-23.20 per hand).
Normal Loose %
Normal Profit
Loose % after big loss
Profit after big loss
Loose % after big win
Profit after big win
Top 10
21.1%
$8.59
20.7%
$6.93
19.8%
$5.79
Bottom 10
28.1%
($9.43)
35.3%
($23.20)
32.7%
($11.59)
Table 3: Top players stay closer to their “A game” after big wins or losses.
So, what about hand ranges? We know that top players are more selective, but what specifically does that mean? As I started looking through sample hands for the top players, I noticed that an unusual number of them were making aggressive plays because they were short-stacked (had less than $1000 when the blinds are $25/$50). There were a lot of hands where someone would raise before the action got to them and they would just respond with an all-in, especially if the raise came from the button…
(Note: the all-in raise was to $1000, but $25 was already in the pot from the SB)
Then I realized there were a LOT of hands like this and that they were primarily from two of the ten players. Sure, enough, when I looked more closely, it turned out that they were buying in as short-stacks, doubling up, and then switching tables, only to buy-in as short-stacks again – a strategy described as “hit and run” or “rat-holing”, which can be a surprisingly profitable and annoying strategy in cash-games.
Because people think of short-stacks as being in a position of weakness in tournaments, many don’t realize that it’s actually a strategic advantage in cash games (well, the pros do, which is why they’re generally not fans of rat-holers). Not only is it relatively simple to play (often, it’s just one all-in re-raise before the flop), it puts the bigger stacks in very awkward positions. Sometimes, they’re basically forced mathematically to call a bet, even if they suspect they have the worst of it.
Consider the hand above, but suppose the short-stack player (QJs) showed his hand as he went all-in, so the original raiser (44) could make a perfectly informed decision. The decision that 44 faced was whether or not to call another $825 for a chance at $2050. Since $825 / $2050 is 40.24%, a Hold’em Calculator tells us that it’s a clear call (44 vs. QJs has a 48% chance of winning). By making the correct call here, the original raiser can expect to win 48% * $2050 = $984 (hence, “pos EV” or positive expected value for the call). That’s a good amount better than the $825 it cost to call the bet, but it’s worse than if the player had just sat out the hand and never had to shell out $1000 for the experience. And this was in the case where the short-stack player had a mediocre hand! Often, an all-in from the blinds here means a medium or high pair, in which case the raiser would win less than 20% of the time. So, the call is not automatic by any means! In summary, when an initial raiser gets shoved on by a short-stack, they’re put in a very tough spot in which they’re just trying to lose as little of their money as possible.
From an earlier life, I know a bit about this short-stack style of play (shhh!) so I wasn’t completely surprised to see two short-stackers in the list of the top 10 most profitable players. They weren’t as profitable per hand as the others top players, but they made up for it with volume (often being a short-stack is so easy to play, you can play many tables simultaneously). Most notably, the short-stackers were MUCH more aggressive than the other players, due to the large number of all-ins and relatively few check/call type hands…
Sing it: Which of these players are not like the others?
Since these players truly had a distinctive style, I lumped them together; let’s call them a prototypical successful short-stacker. Here’s what I found:
Under the Gun: When seated in the worst position, they showed down the following hands (recall that “AKs” means Ace-King suited, while “KJo” means King-Jack offsuit):
[A A][Q Q][T T][9 9][5 5][AKs][AQs][ATo][KJo]
Assuming that they chose their playable hand range according to how well they rank against a random hand in a showdown, this looks like about the top 14% of possible hands (55 is the worst hand in the group by this metric, winning only 60.32% vs. a random hand, so their range would include each hand type down to “55” at the link above). This is significantly tighter than the typical player UTG (20%), so if you see an experienced short-stack player raising from UTG, you’ve been warned about what you’re up against!
[Note: if you want to figure out the top x% range yourself, just put your list of ranked hand types in Excel with a column next to them showing the number of ways to get dealt each type of hand. Card combinatorics tell us that pairs can happen 6 ways, suited cards 4 ways, and unsuited non-pairs can be dealt 12 ways. If you include all possible hand types in your list, the “ways” column should add up to 1326, the total number of different two-card poker hands. Now, you can calculate the total “ways” for the set of hands you’re interested in, divide it by 1326, and you’ve got your percentage!]
Middle Position: In this position, they showed down a wider range:
This looks like the top 20% hands (every hand above QJo here). Hmm, 5 players left in the hand, 1 in 5 = 20%? It’s possible these players didn’t base their playable hand ranges on historical data, but rather just on the number of opponents left to act (in which case they may actually play 1/6 = 16.7% of their hands from UTG).
You can see why the aggression rating for these guys is off the charts. When dealt a pair and playing with a short-stack, it doesn’t make sense to call a raise and hope to hit a set, because the pot size won’t be big enough to justify the gamble. In this case, the short-stacker correctly predicted that the hand would be a coin flip, so he bet $800 for an even chance at $2800.
Cutoff Position: They showed a similar range here, so it looks like top 20% again…
The loosest hands here are 98 offsuit (48.1% vs. random hand!) and J7 suited (52.32% vs. random hand).
Blinds: The sample hand at the beginning of this article shows that they will re-raise all-in out of the blinds even with a hand like QJ suited, which barely makes the top 20%, so it appears that they’re expecting other players to be just as loose as they are with their button raises. Here’s the whole set of hands they re-raised out of the blinds with…
In summary, they’re playing tighter than normal in the early position, looser than normal from the button, and much more aggressive than other profitable players. If they’re not in the blinds and someone raises before them, they typically push all-in with the top 10% of dealt hands. This is consistent with their overall strategy: find spots where (based on very limited information) they think they have an above average hand against their opponent’s range and then shove all of their chips in and hope for the best. It’s a pretty simple approach, and worked well ($80k profit in a few months for the two of them at the $25/$50 tables isn’t bad!)
If you’re new to poker, I’d recommend buying in with a short-stack and playing selectively and aggressively like these guys. The deeper the stacks, the more complicated the game gets and the more vulnerable you are against the more experienced opponents. If you don’t have many chips and Daniel Negreanu raises pre-flop and you push all-in on him, it doesn’t matter that he’s ten times better than you. He has to decide whether to call or fold and can’t bluff you out. Be warned however: he might have read this article and you may not be happy when he flips over his cards!
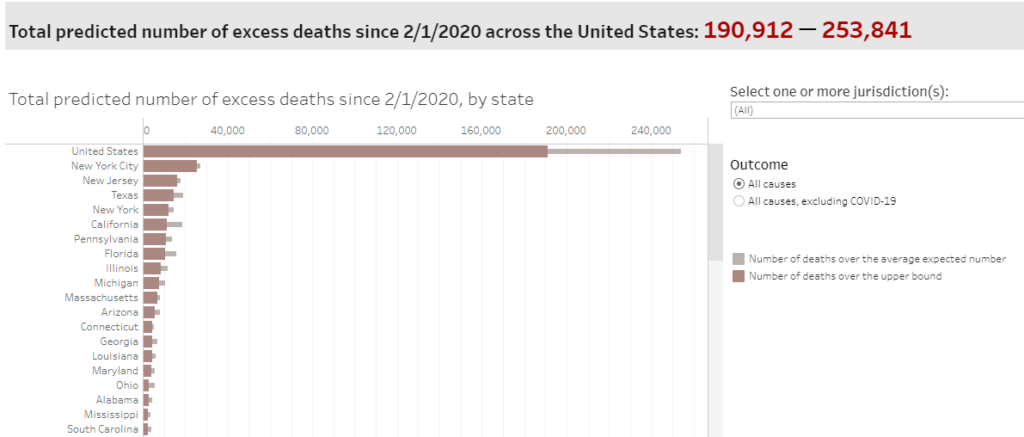
So, are you tired of arguing about things like whether or not the CDC stated that only 6% of the official deaths were due to COVID-19? Me too. (By the way, the easiest way to show that, if anything, the death count is an underestimate is to point out that the excess deaths in the U.S. this year are at about 250,000. Why would that be, if not for COVID-19?)
Figure 1: Where did all the extra deaths come from if COVID-19 is overcounted?
Well, you’re in luck, because this article is not going to talk about the pandemic (anymore). Let’s all take a break from the daily death toll and the decline of democracy and talk about POKER.
Well, not just about poker, but also about how to approach historical data and carefully draw conclusions from it. There’s no surefire way to answer questions without controlled and randomized experiments, but that doesn’t mean that observational data is worthless. The goal when digging into historical data is to not fool yourself. You need to determine which patterns are meaningful and which are spurious. If there’s a confounding variable that you didn’t think of, you could end up with pie in your face when you present your conclusions to someone who did think of it. Since nobody can think of everything, it’s good practice to consider what answers would make sense, given your understanding of the subject at hand, before you look at the data for answers. Let’s see if I can dodge the pitfalls of data-mining as I look for insights into what makes a successful poker player.
Before we shuffle up and deal, I suggest you brush up on how to play No Limit Texas Hold ‘Em. It’s a fantastic game and it will basically train you how to make good decisions by literally making you pay for superstition and irrationality. You learn that good decision-making doesn’t always result in good outcomes in the short-term, but it will eventually pave the way to success. If you play long enough, you will see that players around you whose strategy depends on their emotional state end up sliding their chips your way, sooner or later. Poker initially appears to be a game of chance, but if you take it seriously, you’ll be rewarded with the realization that you’re no longer a slot-machine player, relying on luck for your success; you’ve become the casino. What may have started out as gambling has become an investment opportunity with a positive expected return.
Anyways, let’s get to the data. A little bird provided me with hand history for over 930,000 online poker hands (at tables limited to 6 players) from about a decade ago. The blinds were $25/$50, which is high enough to be considered “serious” poker. It’s not unusual for a player to have over $10,000 at the table and, in the 3 months of data, three players made a profit of over $100,000 (one player lost over $100,000, so over this time period, poker was a more expensive hobby than golf!).
The first (and most time-consuming) step in a data scientist’s workflow is to get the data into a useable format. In this case, the data came as a semi-structured text file such as the following (names anonymized to match their position at the table)…
Game #5811672164: Table Rock Port (6 max) – $25/$50 – No Limit Hold’em – Seat 1: MiddlePositionPlayer ($575) Seat 2: CutoffPlayer ($6,244.75) Seat 3: ButtonPlayer ($7,694) Seat 4: SmallBlindPlayer ($6,297) Seat 5: BigBlindPlayer ($9,522) Seat 6: UnderTheGunPlayer ($6,100) SmallBlindPlayer posts the small blind of $25 BigBlindPlayer posts the big blind of $50 The button is in seat #3 *** HOLE CARDS *** UnderTheGunPlayer folds MiddlePositionPlayer has 15 seconds left to act MiddlePositionPlayer folds CutoffPlayer calls $50 ButtonPlayer folds SmallBlindPlayer raises to $250 BigBlindPlayer folds CutoffPlayer calls $200 *** FLOP *** [4h 7s 7c] SmallBlindPlayer bets $400 CutoffPlayer calls $400 *** TURN *** [4h 7s 7c] [3s] SmallBlindPlayer checks CutoffPlayer checks *** RIVER *** [4h 7s 7c 3s] [Ts] SmallBlindPlayer checks CutoffPlayer checks *** SHOW DOWN *** SmallBlindPlayer shows [6d 8d] a pair of Sevens CutoffPlayer shows [Jh Jd] two pair, Jacks and Sevens CutoffPlayer wins the pot ($1,347) with two pair, Jacks and Sevens *** SUMMARY *** Total pot $1,350 | Rake $3 Board: [4h 7s 7c 3s Ts] Seat 1: MiddlePositionPlayer didn’t bet (folded) Seat 2: CutoffPlayer showed [Jh Jd] and won ($1,347) with two pair, Jacks and Sevens Seat 3: ButtonPlayer (button) didn’t bet (folded) Seat 4: SmallBlindPlayer (small blind) showed [6d 8d] and lost with a pair of Sevens Seat 5: BigBlindPlayer (big blind) folded before the Flop Seat 6: UnderTheGunPlayer didn’t bet (folded)
Since I wanted data summarized by player, I created a custom computer program with class objects in code that represented players and tracked of all of their stats, such as “looseness” (VPIP, or Voluntarily Put In Pot, which is the percentage of hands a player plays) and “aggression” (the ratio of bets/raises to checks/calls). Each player “object” also had properties tracking their profit, number of hands played, etc. Note that the profit for each player is not simply the total size of the pots they won. For the example above, the CutoffPlayer won a $1347 pot, but $650 was his own money, so the profit for the hand was $697. The need to extract implicit information of interest is why custom code is necessary for the import and that there is no simple “just load it into a database” approach.
After the file was imported, the summary statistics for each player were exported to a text file for easy analysis in Excel. I also tracked stats for 6 additional virtual “players” representing each of the 6 seats at the table: Small Blind, Big Blind, Under the Gun, Middle Position, Cutoff, and Dealer Button. These stats duplicated the actual player stats, but allowed me to look at how the average player acted depending on their position for the hand.
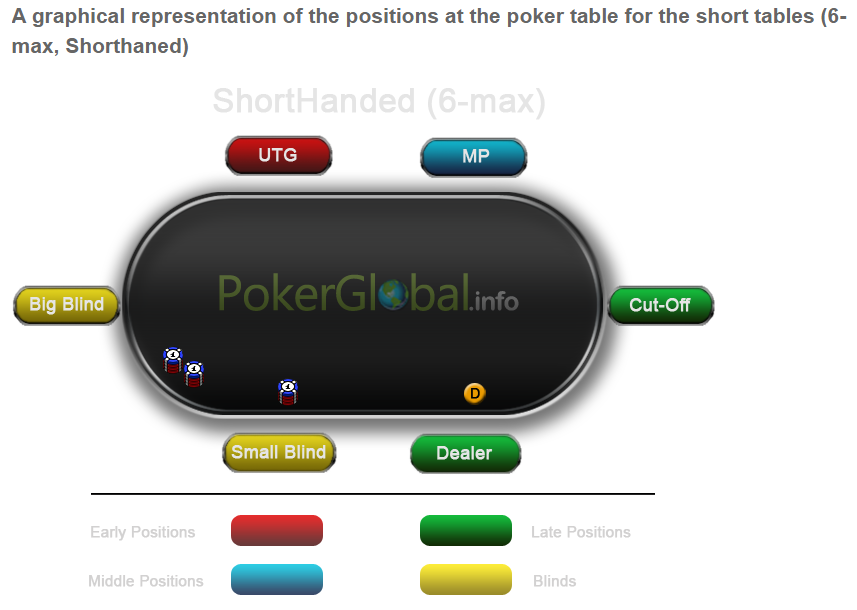
If you’re not familiar with them, these are the positions at a 6-max table…
Figure 2: Table Positions. Betting order is clockwise and the dealer gets the last word.
Another good reason to track stats by position is so that we could do a “reality check” and ensure that the imported data makes sense. For example, players generally play fewer hands when in early position, because the more players that follow you in the betting order, the bigger your disadvantage. We would expect to find that players in unfavorable positions at the table would not only be tighter (more selective about the hands they play) but also more passive (playing more defensively by betting and raising less, in order to limit the size of their losses).
Let’s see what the data says.
Position
Looseness(VPIP)
Button
36%
Cutoff
22%
Middle Position
22%
Under the Gun (UTG)
20%
Big Blind (BB)
22%
Small Blind (SB)
28%
Table 1: Position ranked by Looseness
So, players who were first to act (UTG) only played 20% of their hands. For a sense of what this means in terms of poker hands, if you were to rank the two-card hand types according to how well they match up against random cards, the top 20% would include every hand at least as good as the following: Ace-Three suited (>=A3s), Ace-Seven offsuit (>=A7), King-eight suited (K8s, K9s, KTs, KJs, KQs), King-Ten offsuit (KT, KJ, KQ), Queen-Ten suited (QTs, QJs), Queen-Jack, or pairs of fives or higher (>=55). (Note: “suited” just means that the two hole cards have the same suit.)
As expected, the Looseness increases as the player sits closer and closer to the Button (the Dealer position). Sitting in the best position allowed players to play over a third of the time. It’s trickier to know what to expect in terms of looseness of the blinds, since the Small Blind is in a horrible position, but has already paid some of the price of playing. Similarly, the Big Blind only needs to add money to the pot if somebody raises before the flop. Nevertheless, these stats look reasonable, so I’m feeling pretty good about the imported and organized data.
How about Aggression (ratio of bets/raises to checks/calls)? Again, you would expect players in good positions to be betting and raising more (playing offense), while players in bad positions are checking and calling more (playing defense) to keep the pot size under control. Let’s see if the data matches this expectation.
Position
Aggression
Button
2.1
Cutoff
1.9
Middle Position
1.9
Under the Gun (UTG)
1.8
Small Blind (SB)
0.9
Big Blind (BB)
0.4
Table 2: Position ranked by Aggression
Aggression almost perfectly sorts the positions from best to worst! The only exception is that the small blind is the worst seat after the flop (first to act), but these players were more aggressive than the big blind. This can be explained by the fact that the small blind at least chose to enter the hand (at a discount), whereas the big blind sometimes saw the flop with two random cards (if nobody raised before the flop, they can “check” and continue in the hand for free). So again, the data looks reasonable given what we know about poker strategy.
While there aren’t any notable surprises in the data yet, if you believe in the wisdom of the masses, it does confirm that you should play looser (more hands) when you have a good position at the table, playing about a third of all hands dealt when you have the dealer button. It also backs up the idea that players in the blinds should be primarily checking and calling, while players in good position should be betting and raising. The better your position, the more aggressive you can be; with the dealer button you can bet/raise more than twice as often as you check/call.
Now comes the part that really matters: profit. Which positions are the most profitable and which ones cost you chips?
Position
Success(profit per hand)
Button
$11.09
Cutoff
$6.85
Under the Gun (UTG)
$6.68
Middle Position
$6.19
Small Blind (SB)
$(9.48)
Big Blind (BB)
$(15.50)
Table 3: Position ranked by Profitability
This clearly shows the importance of position. All things being equal, the player sitting with the dealer button is expected to make almost twice as much money as anyone else! It’s hard to see image how one seat can be so much more profitable than the seat next to it, but there is one thing that’s unique when you have the button: if everyone folds to you pre-flop, it’s just you against the blinds (and they have to act first in every future round of betting). It’s a great spot to raise and win immediately or build a pot where you have the advantage of acting last. Even the cutoff seat right before the dealer runs the risk of the dealer calling or raising their bet and having to play the rest of the hand out of position. In short, the dealer is the only one who’s guaranteed to have a positional advantage.
It’s not a surprise that the blinds are the most expensive seats at the table, since you are literally forced to bet, regardless of your cards. The profitability of the other positions sorts them as expected, except for one: players under the gun (first to act after the blinds) made more money per hand than players in the middle position. Since there’s no good reason why this should be generally true, I wouldn’t read too much into it. The difference is only $0.50 per hand at the $50 big blind table stakes so it may be that there were just a few monster hands that swayed the results.
Note that we don’t just look at total dollars won, since sometimes there are fewer than 6 players at the table and the seats in the worst positions are empty. Technically, the players at the middle position made more profit than the players under the gun ($793k vs. $544k), but since there were 128k hands dealt with a player in the middle position and only 81k hands dealt with a full table (and therefore included a player sitting under the gun), the UTG position made more profit per hand.
It’s good to see that the small blinds and big blinds are losing less than $25 and $50 per hand respectively, or they would have been able to improve their results by simply folding their hands every time they were in the blinds! I was a bit surprised to see that every position other than the blinds was actually profitable on average. Since we know that the poker site is making money from the rake, the total losses must exceed the total wins (in this case $153,500 went from the players to the online cardroom during the months observed). Surprisingly, the losses for the two blinds ($4.75M) more than offset the total winnings from the other four positions at the table ($4.60M).
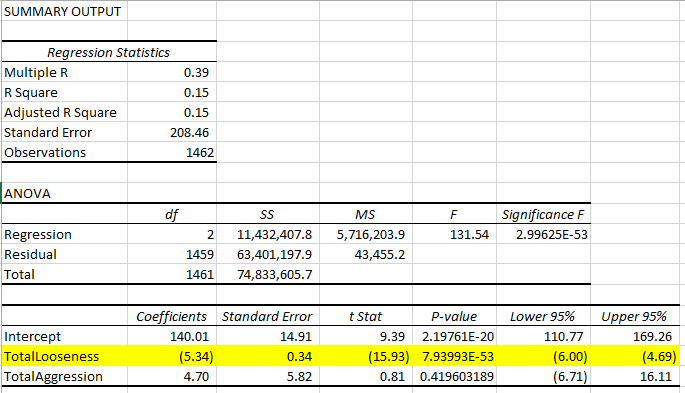
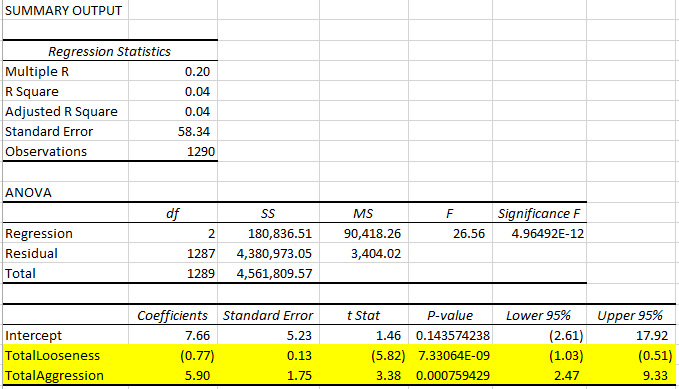
Let’s move on from stats by position and look at the stats by player. The big question is whether or not playing tight and aggressive (TAG) is generally the winning formula for poker. Excel has a nice Data Analysis add-in that allows you to easily run multiple linear regressions. Basically, you just highlight the profit per hand column as the target variable and select the looseness and aggression columns as your predictive variables and see what it comes up with…
Table 4a: Tight is right. Aggression is not so clear.
While the general conclusions seem reasonable, there’s something a bit strange about the p-value; it’s off the charts! Are there any gotchas we should be looking for? Remember what we’re predicting here: the profit per hand. Well, what if someone just played one hand and won or lost a lot?
Sure enough, there was one player, who sat down with $5,000, ended up going all-in on his first hand and losing, never to play again. His profit per hand is -$5000 and he played 100% of his hands. Similarly, there are 15 others who all played exactly one hand and lost more than $1000, never to return. These outliers need to be removed from consideration, because the extreme looseness and results dwarf any of the values you’d see with regular players and will warp our conclusions. Let’s limit the data to players with at least 10 hands played and see how that changes things…
Table 4b: Tight and Aggressive are the way to go!
Well, the p-value is still pretty outrageous, but we peeked at the raw data and nothing jumped out as an obvious problem, so we’ll run with it. Looking at these results, I’d state with confidence that the tighter players generally make more money. Obviously, you can’t take this to the extreme and say that the best player would play 0% of the hands, but you can say that when comparing any two players in this data set of 1290 players, the tighter player is probably the more profitable one. And the tighter the player, the more profitable you’d expect him or her to be.
What about aggression? Now that we’ve removed the outliers, it appears that more aggressive players are also significantly more profitable on average.
The R-squared value of 0.04 is very low, which tells you that knowing only aggression and looseness can only “explain” 4% of the variation in the profitability between the players. More specifically, if you used the equation suggested by the coefficients above [profit per hand = $7.66 – 0.77 * Looseness + 5.90 * Aggression], your predicted profit would only have a 0.2 correlation with the actual player profitability in the data (R-squared is the correlation squared – a 1.0 correlation would be a perfect prediction, and a 0.0 correlation would mean your prediction may as well have been completely random).
Recall that while we have extremely high confidence that profitability is associated with aggression and negatively associated with looseness, we still have to take this with a grain of salt since we’re just analyzing historical data and not the results of a controlled experiment. There could be a hidden confounding variable that we should be considering. For example, what if we break down the data by how many players are at the table? Conventional wisdom states that as the number of players at the table decreases, you should loosen up the range of hands you play and also play more aggressively. Let’s see what we get if we re-run our regression analysis on 6-player, 5-player, 4-player, 3-player, and heads-up situations.
Number of Players
Looseness Coefficient
p-value
Aggression Coefficient
p-value
6
$(1.28)
0.000
$1.76
0.281
5
$(0.47)
0.007
$3.16
0.110
4
$0.02
0.934
$1.34
0.499
3
$0.15
0.607
$0.58
0.822
2
$(0.12)
0.680
$9.61
0.004
Table 5: Importance of Looseness and Aggression by Number of Players
There are a couple interesting things here! The first is that the cost of playing loosely is only significant when there are 5 or 6 players at the table. Another finding: playing aggressively isn’t particularly predictive of success (although generally good) unless it’s one-on-one. These results are a bit surprising, but not necessarily out of left field (which is a good thing when you’re worried about data-mining). In summary, you want to be the tightest player at the table when it’s 5 or 6 handed. But if it’s heads-up, you want to be the aggressive player.
Let’s look at how the average players actually played, depending on their number of opponents. And, more interestingly, let’s see how the 10 biggest winners (by total profit) and the 10 biggest losers played…
#
Avg Looseness
Avg Aggression
Top 10 Loose.
Top 10 Aggress.
Bot 10 Loose.
Bot 10 Aggress.
6
28.7%
1.12
22.7%
1.97
29.3%
1.20
5
29.8%
1.02
24.3%
1.92
28.3%
1.37
4
34.2%
1.05
29.8%
1.89
28.9%
1.14
3
40.8%
1.09
33.8%
1.59
37.5%
1.49
2
50.3%
0.97
47.5%
1.57
45.9%
1.35
Table 6: Looseness and Aggression by Number of Players
As expected, everyone loosens up as the number of opponents decreases. However, notice that the 10 biggest winners are consistently playing 4-7% fewer hands than the average player (with the exception of heads-up situations). Interestingly, both the best and the worst players are more aggressive than average, but the best players do consistently bet and raise more than they check and call. Again, there may be other variables at play, such as that the best players are more likely to seek positional advantage (which in turn leads to more aggressive play). However, describing them as Tight and Aggressive does appear appropriate.
Next time, we’ll discuss more specifically how the most profitable players play. The great thing about poker hand history files is that you can often see cards at showdown and then match them up with the betting patterns from the player earlier in the hand for analysis. With enough data, you’ll have a pretty complete sense of the types of hands people play and how they play them. To me, this is what makes poker so interesting. It needs to be studied in the context of what people actually do, rather than what is best in some theoretical sense. It’s not the optimal strategy you seek; it’s the exploitive one.
I would not describe myself as a “gambler.” Although I enjoy thinking about casino games, I almost never play them. One exception was the time my wife and I went with friends to a casino in Barona. While we were there, we saw a promotion: if we join their card club and play slots for 2 hours, they would refund our losses or double our wins, up to $200. After confirming that we could ensure ourselves no worse than a break-even gambling session, my friend and I hit the video poker machines. We played for $1 a hand until there were 15 minutes left. I still had $150 of my $200 left, so I bumped up the bets to $5 each. Then, I hit a royal flush. I waited at the machine until someone came and counted out $4000 in cash. After he handed over the stack of money and left, I realized that any losses occurring now were actual losses, so I stopped playing and waited out the remainder of the time before collecting my additional $200 matching prize and leaving the casino. I haven’t played video poker there or anywhere else since then. Casinos must hate guys like me.
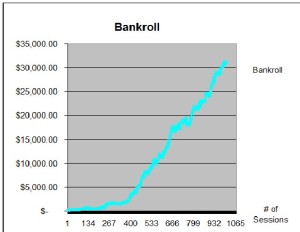
When I started playing online poker (against people, not casinos), I only invested $50 and slowly built my bankroll up to $100. At that point, I was so paranoid that other players would cheat me or beat me out of all of my money, I took out my initial $50 back out. From then on, I was on “house money” and never looked back.
After my father-in-law found out that I was playing online poker and saw my chart above, he took my wife aside and advised her to secretly stash away some money so she could take care of our daughter when I inevitably blew through all of our savings. She just busted up, because he obviously didn’t know me very well.
The first guy that I met with an actual gambling problem was someone I worked with when I was a software developer consulting for HdL Software. He would not only sneak out of his house at night to go to the casino (leaving his young kid alone), his game of choice was the one with arguably the worst odds in the house: Keno. It wasn’t enough that he played with a horrible return on investment; he would have the computer to continually auto-pick his numbers for him without even requiring him to push a button. And as if that weren’t enough, he’d have two machines running at a time and burning through his money while he would stand there enjoying a drink.
Of course, occasionally he’d show up at work with a wad of cash talking about his big win. However, even he had no illusions about the direction of his cash flow. He estimated that his hourly loss was around $100 for each hour he spent in the casino. He wanted to quit, but just couldn’t. I was curious why, if he was going to gamble, he wouldn’t at least play games with much better odds, like blackjack. Eventually, I figured out that it was because blackjack doesn’t have the potential for a “big win”. You typically can only win twice the amount that you bet. So I came up with an idea for him.
I asked him what he considered a “big win” and he said $20,000. I looked it up, and for you to win $20k with a $1 bet, you need to pick and hit 8 numbers. The chances of this occurring are 0.00043%. So here’s what I told him to do: learn and play basic strategy at blackjack, but when he wins a hand, let it ride and bet his winnings on the next hand. For example, if he were at a $1 table, if he doubled up 15 times in a row, it would be worth $32,768! His response was that the chances of winning 15 hands in a row was too incredibly low. I showed him how, at about 49.5% chance of winning, the odds of 15 wins in a row is 0.00262%, or about 6 times as good as the Keno big win, and it paid over 50% more! When the logic sank in, rather than switch to blackjack, he actually stopped gambling for the first time since I’d known him. Until that moment, he had never truly realized how badly the odds were stacked against him. Of course, he started gambling again a few months later, but I had almost cured him.
The second guy with a gambling problem I met was someone who got so tired of losing his money at online poker, he had told the bank to stop allowing him to send money to online casinos. When he found out I had developed a simple all-in or fold poker strategy that was exploiting the fact that some poker sites allowed you to buy-in as a short-stack, he desperately wanted me to teach it to him. I was pretty sure that “the System” would probably work for him, as it had for others who knew much less about poker, but had a feeling it wouldn’t end well. However, the question nagged at me: if someone with a gambling addiction actually had a strategy that made money, would he still have a gambling problem? Or would he just be a profitable work-a-holic?
I eventually shared the System with him and at first, he was a poker monster. He made $12,000 in the first month. Once, when he took my wife and me out to dinner to celebrate his success, I asked him to show me his bankroll chart and it didn’t quite look like mine. His had occasional huge losses in it. I asked what that was about and he said that other players would heckle him through the chat box and challenge him to heads-up matches, which he would eventually accept and get crushed. He turned to my wife and said “I’m sick Cathy.” (she’s a psychotherapist) “It’s horrible when you know it about yourself.” I told him to turn off the chat window!
He seemed to be under control and profitable until he told me about his plans to play at the $50 big blind level. Even buying in as a short-stack meant he’d be betting $500 on each hand. I had never played at or evaluated the system above the $20 big blind level, so I didn’t recommend it. The System was exploitive, not optimal. That means that it could be beaten by knowledgeable players, and generally, the higher the stakes, the more knowledgeable the player. Even though my friend was making a lot of money, he had gotten bored. His first trip to the $50 big blind level didn’t go well; he lost $4500 in one evening. He didn’t keep me up-to-date on his results anymore, but when I ran into him much later, he admitted that he had given the entire $12,000 back to the poker economy. The experiment had run its course and his gambling addiction had emptied his wallet again, even when the game should have had a positive expected return.
Other friends had their own stories with the System. One friend said he was willing to invest $1000 and was full of confidence. I told him to start out at the $2 big blind level, betting $20 per hand, and trained him for about an hour at my house. He had learned the strategy well and was ready to go home and try it on his own. An hour later, he called us up…
“I’m taking you guys to steak dinner, I’m up $1000!”
“That’s not possible at the limits you’re playing at.”
“I’m looking at my balance right now and it says up a grand.”
“Go back to the table you were playing at.”
“Hmm, it’s not letting me buy back in for less than $940.”
“The maximum buy-in for those tables is $200!”
Then, I realized what had happened. He had accidentally played at 10x the stakes he intended to. He had been betting $200 per hand instead of $20 and just happened to get lucky. His ADD sometimes caused him to let little details like that slip by. However, on the bright side, it also gave him the super-power to play 10-12 tables at a time, which would have given me a stroke due to the stress of trying to keep up. He eventually made well over $10k and unlike the gambler, he kept his winnings.
My favorite success story came from a friend who couldn’t be more different from the problem gamblers. He promised to stick to the System and told me “as an upstanding actuary, I have absolutely no creativity.” He told me he didn’t play poker and didn’t like gambling and I told him “you’re perfect.” His statistical mind and distaste for gambling gave him endless patience to play at low stakes. He never went down more than $2.50 and was continually playing at micro-stakes to ensure it stayed that way. I started to harass him into playing higher stakes and eventually his wife joined in, saying “I don’t want my husband playing a video game all day for $4 an hour.” He finally relented to the pressure and bumped up the bet-sizes. It paid off as he soon pocketed a few thousand dollars. At one point he wrote me this email:
“I had a rough night tonight and then a roller coaster ride at the end. Could not win anything. Even my best hands ended up split pot, until my final table.
$4 bb…I get an AK so of course I go all in. I get 1 caller and I get 2 more K’s on the draw to beat his pocket 10’s. Whew. I now have $120 in my stack. Then on my last hand, I get an AK suited. I almost did not want to go all in given my bad luck all night, but I follow the rules and go for it. One guy folds and says ‘it is tiring folding after the stupid ass betting in front of me.’ Then, the next guy calls me, the same one from the last hand.
The cards come out as 7,6,A,A,A. Sweet!
He had pocket queens but my 4 aces beat his full house for a big win! I then left the table to a comment of ‘now he leaves’. I ended down on the night with -$80. So those last few hands saved my ass.
Such drama! I love it.”
A couple of things impressed me about this email: First, he didn’t get superstitious like most people and allow his previous bad luck to make him risk-averse or risk-seeking. He knew that risk is not to be avoided or sought out, it is only to be weighed. He trusted that the System worked and went all-in for that reason and that reason only. The other thing that struck me is that he was happy to end the session down $80. Poker is actually just one long session, but most people have a hard time calling it a day when they’re down. They’re tempted to keep playing even after they’re tired, and maybe even increase the stakes in an effort to get even again. The outcome shouldn’t really matter to you, just the quality of your decisions.
So is poker gambling? It can be, but doesn’t have to be. Played profitably, it’s more like an investment that can be relied on to eventually provide a positive return. Is it a game of skill? Most definitely.
In the game of Texas Hold ‘Em, each player’s hand at showdown is composed of the best five cards out of seven: their initial two cards plus five community cards (cards shared by all of the other players). You probably already know that AA (“pocket Aces”) is the best hand to start with, but what is the worst? Many people say 7-2 offsuit, since it’s the lowest hand that, unlike 3-2 offsuit, has no potential to make a straight. However, if you were offered a choice between the two hands in a heads-up situation, you’d pick 2-7, since it’s ahead (has the highest card) before any additional cards are dealt. Poker calculators, like this one, show that 7-2 has a 55.87% chance of beating 3-2 if all five community cards are dealt out (with an 18.15% chance of a tie). These probabilities are calculated by dealing out all possible future sets of 5-cards and tracking the results.
Now suppose I offered you this challenge: We can play heads-up poker (no-limit Texas Hold ‘Em), each selecting our own hand from one of three possible starting hands, and you get to pick your cards first. I’ll even tell you my strategy ahead of time: it will be to go all-in, as soon as possible, every hand. The three hands to choose from are:
(1) A pair of 2s, (2) Jack-Ten suited, or (3) Ace-King offsuit
Which hand would you pick?
At first, AK looks good, since it’s considered one of the top starting hands in general. However, even a pair as low as 22 wins 52.75% of the time vs AK, since it’s already a pair and the chances that an ace or a king shows up when the next five cards are dealt out is less than 50/50. So, do you pick 22 as your starting hand? If so, I would select Jack-Ten suited, which, thanks to possible flushes and straights, actually DOES have a better than 50/50 chance of improving to the winning hand (53.28% chance of winning vs. 22). So, Jack-Ten suited must be the best hand? Not so fast: AK has a 58.61% chance of beating Jack-Ten suited. This is a non-transitive game! Simply by choosing first, you will be at a disadvantage.
Here’s another surprising poker scenario that actually occurred during a tournament I played on a cruise. I was very short on chips and was in the big blind (a forced bet, like an ante), which required me to put a third of my chips into the pot before even looking at my cards. Everyone folded around to the guy next to me, who went all-in. I looked down at my hand and it was one of the absolute worst: 8-2 offsuit. Easy fold right?
Believe it or not, I should call and here’s why: I had 1200 in chips before the hand and 400 of them went into the pot because of the blind bet. That means that I had to decide whether or not to call 800 for a chance to double-up to 2400 (when an opponent goes all-in for more chips than you have in your stack, it’s the same as if he only bet the amount you have left). When you look at it that way, it becomes clear than any chances of winning over 33% will make me a profit in the long run. Suppose someone were offering $1 lottery tickets that win 40% of the time and had a prize of $3? You’d buy as many tickets as you could get your hands on, even though the odds are against winning. It’s the expected profit of $0.20 per ticket ($3 prize * 40% chance = $1.20 on average) that compels you to “gamble” in this case.
It turns out that if you assume my opponent was going all-in with a random hand here, I actually have about a 34% chance of winning. When I called, he kicked himself for not realized that I was so short-stacked that he didn’t have any fold equity (value in bluffing). I caught him with a measly 4-3, but he ended up winning and busting me out anyway.
This is an example of being “pot committed”, which means that it was profitable to call even though I was almost certain to have the worst hand. There are times when this concept can be used to your advantage. Suppose you have $90 at a table where the blinds are $5/$10. Someone raises to $30 and the action gets to you and you decide to go all-in with AK. If everyone else folds and the action gets back to the original raiser, he has to decide whether to call $60 for a chance at a $195 pot (small blind of $5 + big blind of $10 + his original raise of $30 + your all-in of $90 + another $60 if he decides to call). He only needs a $60 / $195 = 30.8% of winning in order to break-even. Suppose he had a 2-3 offsuit and you showed him your AK. He’d still have over a 34% chance of winning and should therefore call! Congratulations, you just got someone to call your all-in with a worse hand than yours, which is good for you.
The very fact that you were low on chips gave you an exploitable opportunity. Since anyone who raises should go through the same mathematical reasoning as above and come to the conclusion that they have to call you, all you need to do is figure out when you have a better hand and collect your money. It may be impossible to know that for any particular hand, but you can ensure that your all-in is expected to be profitable. Online poker allows you to download the “hand history” from the games you play in. If there’s any data wonk living within you, you would realize that digging through those files would give you a good sample of the range of hands that people normally raise with. All you need after that is the handy poker calculator above and the patience to identify which potential hands would beat that range on average. This is precisely the kind of analysis I did to come up with a very profitable “short-stack” strategy for online poker.
It turns out that in the situation above, AQ, AK, and all pairs 7 or higher are profitable for your all-in move. Surprisingly, the range of profitable all-in hands increases to include a pair of sixes at the $10/$20 big blind level, since the original raisers get more creative and have a wider range of hands that they would get stuck calling with. The moral to the story is that while many players focus on “tells” and “feel”, math geeks can and do find profitable situations by simply crunching the numbers. Bad luck will always occasionally strike, but, as a Swedish proverb states, “luck doesn’t give, it only lends.”
By the way, for those interested in how my man vs. machine match against PokerSnowie turned out, see the end of my man vs. machine blog entry here.
So you’ve decided to invest in mutual funds and you’ve narrowed down the list to some promising candidates. You’ve got your Morningstar ratings handy and you’ve got past performance charts. What can go wrong?
Well, there’s one big problem: there’s basically no evidence that better performing fund managers aren’t just getting lucky. A study by Barras, Scaillet, and Wermers estimated that only 0.6% of over 2000 actively managed domestic equity funds actually demonstrated that skill was involved their long-term performance. Even that number wasn’t statistically significant, so the study could not rule out the possibility that absolutely no one knows how to beat the S&P. Since you’re all experts in regression to the mean now, you know exactly what to expect in the future from a fund whose past returns were entirely due to luck. You may as well pick a fund at random, or better yet, just pick the one with the lowest expense ratio, like an index fund. Actively managed funds appear to be charging for expertise that is primarily (entirely?) an illusion!
So if there’s no skill involved, why does it always look like there are so many mutual funds with great track records? It’s basically survival of the luckiest. The funds that are doing the worst are the most likely to get killed off, so when you’re only shown the survivors, you end up seeing what the victims of that stock-picking mail scam got to see: a history of hits with no visibility into the number of misses.
By the way, past performance shouldn’t cause you to hold onto stocks, either. Many people don’t want to sell stocks that have gone down since they purchased them, reasoning that they’ll eventually go back up and make a profit. A good way to find out if you actually believe the stock is still a good investment, ask yourself “if I didn’t own this stock right now, would I buy it?” If the answer is no, you should recognize that by not selling it, you are effectively doing just that. Whatever happened in the past is a sunk cost; you would either prefer to have the money or the stock.
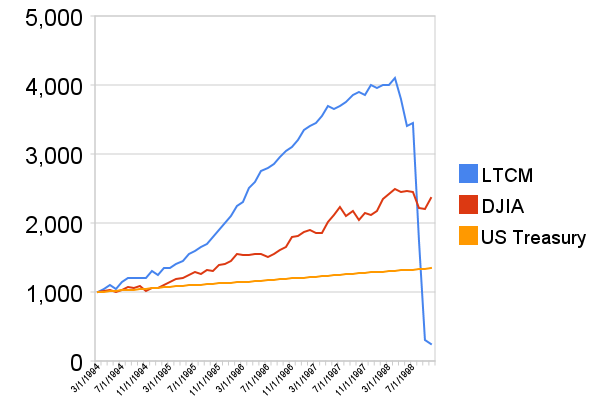
There’s another problem that occurs when you judge investments only on their historical returns. You may find a hedge fund, for example, with huge and stable returns every year and not have any idea that this is coming…
That’s what it would have looked like if you had put $1000 into the top Long-Term Capital Management hedge fund in 1994. If you think that kind of disaster looks like it couldn’t just be the result of good luck finally running out, you’re right; it has to do with financial leverage.
To demonstrate how the illusion of stability can be created through the use of leverage, consider the following simulation I created in Excel assuming a $10k initial investment and nothing better than a coin-flip’s chance at predicting the future. After 13 years, I had demonstrated a completely stable 20% return every year! You’d definitely want in on this fund, right?
Year 1
20%
$ 12,000
Year 2
20%
$ 14,400
Year 3
20%
$ 17,280
Year 4
20%
$ 20,736
Year 5
20%
$ 24,883
Year 6
20%
$ 29,860
Year 7
20%
$ 35,832
Year 8
20%
$ 42,998
Year 9
20%
$ 51,598
Year 10
20%
$ 61,917
Year 11
20%
$ 74,301
Year 12
20%
$ 89,161
Year 13
20%
$ 106,993
You can probably guess that in year 14, it went completely broke. Behind the scenes, I was just following a Martingale strategy where I bet 20% of the money on a coin-flip and, if it didn’t work out, I’d double the size of the bet on another coin flip to make up for it. If that didn’t work out either, I still had 40% of the money left to try to get lucky and recover. If at any point I’d made the right pick and got to a 20% profit, I’d call it a day and wait until the next year to repeat the process. As long as I keep my proprietary trading strategy under lock and key (because it’s obviously so valuable), who’s going to know?
Okay, so forget trying to judge the quality of funds for yourself based on their history, how about using Morningstar ratings instead? Well, it turns out, that would also usually be worse than if you just minimized the expense ratio.
“The star rating is a grade on past performance. It’s an achievement test, not an aptitude test…We never claim that they predict the future.”
Don Phillips, President of Fund Research at Morningstar
At this point, you might be comforting yourself with the fact that you have a financial advisor who knows all of this and can dodge the pitfalls for you and recommend great investments. Unfortunately, unless you are one of the few people who uses a “fee only” advisor, there are probably some serious conflicts of interest that may have transformed your advisor into a salesman. He or she may be quietly extracting commissions of up to 8% for selling you stuff with costs hidden in places you are unlikely to discover.
The moral to the story is: forget about trying to predict the market. Get a “fee only” advisor to help you diversify broadly (into investments with low expense ratios, of course) and with an appropriate amount of risk for your situation, and don’t forget to re-balance every once in awhile. And while you’re at it, quit trying to time the market as well; the time to sell is when you need the money and the time to buy is when you have the money. Get rich slowly.
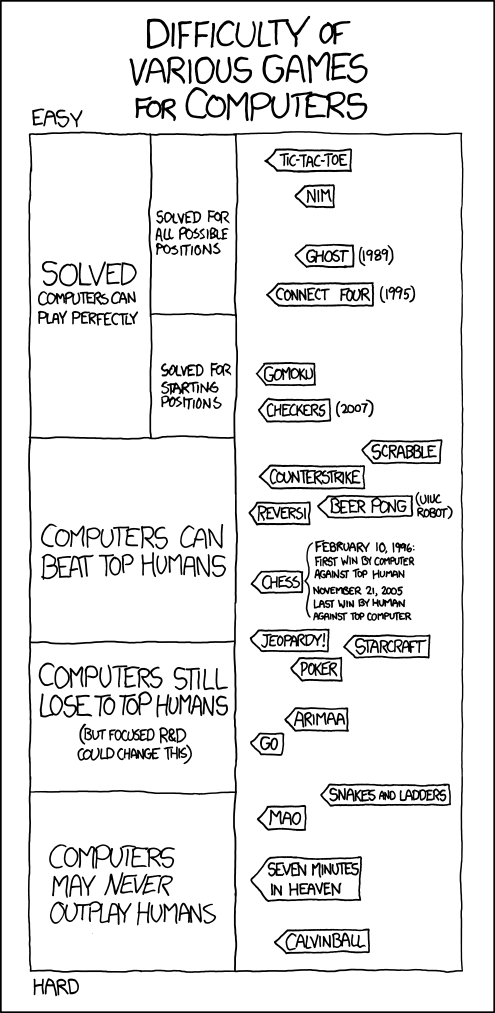
As a game freak and a data wonk, there are few things more interesting to me than the ongoing battle between man and machine, with popular games serving as the battlefield. For each game, there’s only one time in human history when machines take us down and never look back, and for almost all games, that moment in time is in the recent past. These stories of seemingly unbeatable champions finally meeting their match and conceding defeat give us a glimpse into the unlimited potential for future problem-solving techniques. Welcome to my short history of Man vs. Machine.
Backgammon (1979) – BKG 9.8
When world champion Luigi Villa lost a backgammon match 7-1 to a program by Hans Berliner in 1979, it was the first time that a bot had beaten a world champion in any game. Later analysis of the games showed that the human was actually the stronger player and only lost due to bad luck, but Pandora’s box had been opened. In the 90’s, when neural networks revolutionized the bots, machines had truly reached the level of top humans. TD-Gammon was developed in 1991 and was followed in 1992 by Jellyfish and Snowie. There were no databases of moves and no expert advice given to the machines. They were only taught to track certain features on the board (like the number of consecutive blocking points) and to decide for themselves whether they were meaningful. They played themselves millions of times, following a simple racing strategy at first, but soon learned what maximized wins and began to appropriately value and seek better positions. It’s truly like AI; the bots had taught themselves how to play backgammon!
I asked my friend Art Benjamin (who was the all-time point leader in the American Backgammon Tour at the time) when it became clear that bots were truly superior and he said…
I guess I would say it happened in the mid to late 90s with Jellyfish and then Snowie. Can’t offer an exact date and I can’t think of a specific event. There was a backgammon server called FIBS (First Internet Backgammon Server) that was big in the 90s and the top rated player was Jellyfish. Only later was it revealed that it was a Bot. I think that gave it instant recognition as a force to be reckoned with.
At one of the backgammon tournaments, Art introduced me to Jeremy Bagai, who did something that I think is awesome. He wrote a book that used Snowie to locate and analyze mistakes in the classic strategy guides. He basically took the bibles of backgammon and fixed them, according to what the bots had discovered. How great would it be to have books like that in every field, showing specific cases where objective progress has been made? I think the toughest program out there these days is eXtreme Gammon, so maybe it’s time for another edition of that book that corrects Snowie’s mistakes?
Checkers (1994) – Chinook
In 1989, a team led by Jonathan Schaeffer from the University of Alberta created a computer program that could play checkers called Chinook. In 1990, Chinook was already ready to take its first crack at the world title, but fell short against Marion Tinsley. Tinsley, who is considered the best checkers player of all-time, won 4 games to Chinook’s 2, with 33 draws. In the rematch in 1994, it seemed that Chinook might actually have a chance against the seemingly unbeatable human champion (to give an idea of his dominance, Tinsley won his 1989 world title with a score of 23 draws, 9 wins, and 0 losses!) However, after 6 draws, the match came to an unfortunate and premature end: Tinsley had to concede due to abdominal pains, later diagnosed as cancerous lumps on his pancreas.
Using strategies such as minimax heuristic, depth-first search, and alpha-beta pruning, in combination with an opening database and a set of solved end-games, Chinook held onto its title with a 20-game draw against the #2 player, Don Lafferty, but hadn’t yet truly become unbeatable. During the match, Lafferty broke Chinook’s 149-game unbeaten streak, which I believe earned him the title of “last human to beat a top computer program at checkers.”
After the next match, in 1995, it was official: machine had surpassed man. Don Lafferty fell by a score of 1-0 with 35 draws. A couple years later, Chinook retired after being unbeaten for 3 years. If there were any doubts about whether or not Tinsley would still be able to beat Chinook, those questions were put to rest in 2007 when it was announced that checkers was solved. Schaeffer’s team had done it: they proved that checkers is a draw if both sides play perfectly.
Chess (1997) – Deep Blue
Deep Blue became the first computer program to win a chess game vs. a current world champion when it took a point off of Kasparov on its way to a 4-2 loss in 1996. However, what most people remember is the rematch in 1997, which “Deeper Blue” actually won, 3.5 to 2.5. At one point during the match, the program ran into a bug and played a random move, which unnerved Kasparov, since he was familiar enough with computer strategies to know that no machine would have selected the move. Under huge psychological pressure and suspicion that the other team was cheating, Kasparov blundered away the match against the IBM behemoth, which was capable of evaluating 200 million positions per second.
Several matches followed between human champions and top computer programs that resulted in draws, so computer superiority in chess wasn’t actually clearly established until 2005, when Hydra was unleashed on the world. It dispatched 7th-ranked Michael Adams by a brutal score of 5.5 to 0.5. 2005 may also be the year that goes down in history as the last time a human beat a top machine in tournament play (Ruslan Ponomariov). As of 2008, it was still true that humans playing alongside computers (“centaurs”) were superior to bots playing by themselves, but these days, it looks like even that is no longer the case. The top commercial chess programs available today include Komodo, Houdini, and Rybka and they are continuing to improve, leaving humans far behind.
Chess may never be solved like checkers was, but impressive progress has been made on the endgame, which has now been solved for 7 pieces or less on the board. Similar to the insights in Jeremy Bagai’s backgammon book, there are endgames that were presumed to be draws for many years that turn out to be wins if played perfectly, in one case only if over 500 perfect moves are played (good luck learning that one!) I love this quote from Tim Krabbe about his experience with these solved endgames:
The moves are beyond comprehension. A grandmaster wouldn’t be better at these endgames than someone who had learned chess yesterday. It’s a sort of chess that has nothing to do with chess, a chess that we could never have imagined without computers. The Stiller moves are awesome, almost scary, because you know they are the truth, God’s Algorithm – it’s like being revealed the Meaning of Life, but you don’t understand a word.
Othello (1997) – Logistello
This story is short and sweet. Computer scientist Michael Buro started developing an Othello-playing bot called Logistello in 1991 and retired it seven years later, after it dispatched the world champion Takeshi Murakami by a score of 6-0. Othello is so popular in Japan, 9 television stations covered the event. Afterwards, Murakami said “I don’t think I made any mistakes in the last game. I believed I could win until the end.”
Scrabble (2006) – Quackle
The next human champion to fall to a computer in his respective game was David Boys. Boys, the 1995 world champion, had qualified for the honor to face the machine by beating out around 100 humans in an 18-round match. He looked like he would send the machine back for another development cycle after winning the first 2 rounds, but Quackle didn’t crack under the pressure and won the remaining games to take the match 3-2. As usual, beating the world champion wasn’t enough for the game freaks of the world; Mark Richards and Eyal Amir took things to the next level by building a bot that takes into account the opponent’s plays to predict what tiles are in his rack. It then selects moves that block high-scoring opportunities the opponent might have, proving that AI truly is ultimately evil.
Jeopardy (2011) – Watson
In 2011, IBM was back in the business of high-profile man vs. machine matches when it created Watson and took down two of the best all-time Jeopardy champions. In the end, it had a higher score than both humans put together and, as with Deep Blue, the machine itself was a beast: 2,880 parallel processors, each cranking out 33 billion operations per second, and had 16 terabytes of RAM. Despite some humorous mistakes, such as the time it considered milk to be a non-dairy powdered creamer, Watson’s victory strikes me as the most impressive in this list. The difficulty in developing a system able to interpret natural language and deal with puns and riddles and come up with correct answers in seconds (searching the equivalent of a million books per second) is off the charts. We’re in the world of Sci-Fi, folks.
Poker (2015?) – PokerSnowie?
I’m going out on a limb here and predicting that poker is the next game to fall to the bots and that the moment is just about here. Being a game of imperfect information, poker has been particularly resistant to the approaches that were so successful for games such as backgammon, in which the machine taught itself how to play. An optimal poker strategy generated this way tends to include betting patterns that an experienced player can recognize and exploit.
By the turn of the century, pokerbots had gotten pretty good at Limit Hold ‘Em (eventually winning a high-profile heads-up game against professionals), but the more popular variation, No Limit Hold ‘Em remained elusive. The University of Alberta made the first significant step in changing that when they planned to hold the first-ever No Limit category in their Poker Bot competition at the 2007 Association for the Advancement of Artificial Intelligence (AAAI) conference. Coincidentally, shortly after this was announced, a friend of a friend named Teppo Salonen, who had won 2nd place the prior year in the limit competition, came up to my house for a game. I joined others in pestering him to enter the no-limit category, since the competition would never be softer (if it’s possible to consider competition offered by universities such as Carnegie Mellon and the University of Alberta to be “soft”). I knew a thing or two about beating bots at poker, since I had downloaded and beat up on the best bots that were available at the time, so Teppo invited me to serve as his strategic advisor and sparring partner. Months later, after many iterations, (and after Teppo overcame a last-minute technical scare) BluffBot was ready to go and entered the competition. And WON. What we had done didn’t really sink in until I read the response from one of the researchers who were blind-sided by Bluffbot:
They are going up against top-notch universities that are doing cutting-edge research in this area, so it was very impressive that they were not only competitive, but they won… A lot of universities are wondering, “What did they do, and how can we learn from it?”
The following year, the world once again made sense again as the University of Alberta team took the title. Things were pretty quiet for a few years until mid 2013, when PokerSnowie hit the market. As a former backgammon player, seeing the name “Snowie” in the title got my attention, so I was one of the first to buy it and enter the “Challenge PokerSnowie” to establish its playing strength. PokerSnowie categorizes its opponents based on their error rates and was handily beating every class of opponent with the sole exception of “World Class” players Heads Up. I was one of the few who managed to eek out a victory over it (minimum of 5,000 hands played), but could tell that it was significantly stronger than any other bots I’d played against. It was recently announced that the AI has been upgraded, and I suspect that it may be enough to push the bot out of my reach and possibly anyone else’s.
It appears that it’s time for a 5,000 hand rematch against the new AI to find out if it has passed me up as I suspect it has. I’ll periodically post my results and let you know if, at least for a little longer, the poker machines can still be held at bay. See results below!
http://xkcd.com/1002/
Round 1 of 10: after 500 hands (0.5/1.0 blinds, 100 BB buy-in cash game, with auto-rebuy at 70%)…
Jay +$580.50 (+$1.16 per hand)
Error Rate: 7.15 (“world class”)
Blunders: 13
Notes: I’m on a huge card rush, prepare for regression to the mean.
Round 2 of 10: after 1000 hands (0.5/1.0 blinds, 100 BB buy-in cash game, with auto-rebuy at 70%)…
Jay +$609.00 (+$0.61 per hand)
Error Rate: 7.51 (“world class”)
Blunders: 25
Notes: I extended my lead a bit, but not surprisingly, my winrate did regress towards zero. My error rate also crept higher (despite one fewer “blunder”) and pushed me closer to the threshold for “expert”, which is 8. I’m including the error rates so that if Snowie makes a sudden comeback, it should be clear whether or not it was due to the quality of my play suddenly taking a turn for the worse or Snowie finally getting some cards.
Round 3 of 10: after 1500 hands (0.5/1.0 blinds, 100 BB buy-in cash game, with auto-rebuy at 70%)…
Jay +$322.00 (+$0.21 per hand)
Error Rate: 7.19 (“world class”)
Blunders: 31
Notes: PokerSnowie took a big bite out of my lead in round 3 despite a drop in my error rate as well as my blunder rate (only 6 in the last 500 hands). As the Swedish proverb says: “luck doesn’t give, it only lends.”
Round 4 of 10: after 2000 hands (0.5/1.0 blinds, 100 BB buy-in cash game, with auto-rebuy at 70%)…
Jay +$362.50 (+$0.18 per hand)
Error Rate: 7.49 (“world class”)
Blunders: 42
Notes: Despite making a slight profit in the last 500 hands, my error rate increased and my average winnings per hand has continued to drop. The match is still a statistical dead heat.
Round 5 of 10: after 2500 hands (0.5/1.0 blinds, 100 BB buy-in cash game, with auto-rebuy at 70%)…
Jay +$497.50 (+$0.20 per hand)
Error Rate: 7.51 (“world class”)
Blunders: 49
Notes: My error rate crept slightly higher, but I was able to raise my winnings per hand for the first time. Snowie’s going to have to catch some cards in the last half of the match to get that $500 back.
Round 6 of 10: after 3000 hands (0.5/1.0 blinds, 100 BB buy-in cash game, with auto-rebuy at 70%)…
Jay +$40 (+$0.01 per hand)
Error Rate: 7.55 (“world class”)
Blunders: 62
Notes: Wow, what a difference a round of 500 hands can make! Practically my entire lead was wiped out, despite only a slight uptick in my error rate. Just as I was starting to write Snowie off as too passive, it handed me a nice beating. With four rounds left, the match is truly up for grabs.
Round 7 of 10: after 3500 hands (0.5/1.0 blinds, 100 BB buy-in cash game, with auto-rebuy at 70%)…
PokerSnowie +$29.50 (+$0.01 per hand)
Error Rate: 7.88 (“world class”)
Blunders: 72
Notes: Snowie took the lead for the first time in the match, but I’m glad not to be losing by much more. I was down $400 until about 100 hands ago, but after betting a few big draws that hit, I almost pulled back to even. More concerning is the fact that my error rate increased by a big amount this round, almost demoting me to “expert” status. It turns out my biggest blunder led to one of my biggest pots: Snowie says I made a huge mistake betting my small flush on the turn instead of checking. The outcome was great, however, since Snowie happened to hit a set (pocket pair that matched a card on the board) and check-raised me all-in. I called and my flush held up. The last card was a scary fourth heart, so I doubt I would have gotten as much from the hand if I had checked. I’m not sure why PokerSnowie was so sure betting my flush was a mistake (maybe to control the size of the pot in case my flush was already behind or got counterfeited on the river?) Could be a sign PokerSnowie knows something I don’t.
Round 8 of 10: after 4000 hands (0.5/1.0 blinds, 100 BB buy-in cash game, with auto-rebuy at 70%)…
Jay +$583 (+$0.15 per hand)
Error Rate: 7.99 (“world class”)
Blunders: 82
Notes: I hit back with a rush of cards and had my best round so far (in terms of results). Unfortunately, my error rate crept higher again, putting me at the border between “world class” and “expert” in PokerSnowie’s eyes. I would hate for the program to lose respect for me, so I’m going to have to start making better decisions. Of course, PokerSnowie could just be punishing me, since one of my biggest “errors” was calling its pot-sized all-in on the river with one measly pair. It turned out that I caught PokerSnowie bluffing and won $234 on the hand.
Round 9 of 10: after 4500 hands (0.5/1.0 blinds, 100 BB buy-in cash game, with auto-rebuy at 70%)…
Jay +$869.50 (+$0.19 per hand)
Error Rate: 7.85 (“world class”)
Blunders: 85
Notes: Only 3 blunders this time and I extended my lead. It’s looking bad for PokerSnowie, as it will need an epic rush in the last 500 hands to pull out the match.
Round 10 of 10: after 5000 hands (0.5/1.0 blinds, 100 BB buy-in cash game, with auto-rebuy at 70%)…
Jay +$1749 (+$0.35 per hand)
Error Rate: 8.03 (“expert”)
Blunders: 100
Notes: When I posted an “epic rush” would be necessary for PokerSnowie to win, I didn’t actually believe it was possible for $870 to change hands between us in the last 500 hands with $0.50/$1 blinds. Incredibly, it happened, although in my favor. I hit practically every draw and if I didn’t know any better, I’d say the machine went on tilt, as it repeatedly bluffed off its chips like it was a fire sale. The program did get some revenge, however, by demoting my rating into the “expert” range by crediting me with 15 blunders during this round. Let’s look at a few of the big ones:
1. I raised to $3 with QJ on the button and Snowie re-raised to $9. I called and my QJ became the best possible hand when the flop came 89T rainbow (no two cards matching suits). Snowie bet $9 and I only called, reasoning that I didn’t have to worry about any flush draws (and also couldn’t represent them). I also didn’t want to end the fire sale if Snowie was going to keep bluffing at pots. My decision was tagged by Snowie as a huge error. Then, on the turn, a completely harmless offsuit 2 came. Snowie bet again, this time $18, and again I only called for the same reasons. This was also flagged as a major blunder. The river brought another 2, and Snowie continued with a bet of $72. I conservatively called, thinking that an all-in for its last $77.50 here might only get called by a full house (Snowie finally liked my decision, although it said to mix in an all-in 4% of the time). It turns out that Snowie had AA (was evidently value-betting and assuming that I would continue calling with only a pair?) and lost the $216 pot.
2. Snowie raised to $3 pre-flop and I called with K8. The flop came 83T, all diamonds, which was great, since I had 2nd pair and my King was a diamond. I checked, hoping Snowie would continuation bet, but Snowie checked as well. The turn card was a 9 of hearts and I bet $3, which Snowie called. The river card was a 9 of diamonds, giving me the flush, but also pairing the board. I bet $6 and Snowie raised with a huge overbet of $54. It was certainly possible that it was trying to get value for its full house or ace-high flush, but it just didn’t smell right. If it had the ace of diamonds, why hadn’t it bet on the flop or raised on the turn to build a pot? And with a paired board, what would it do if I re-raised its huge overbet on the river? On the other hand, if it had flopped a set (which turned into a full house on the river to justify the huge bet), would it really have checked on the flop and only called on the turn and not made me pay to see a fourth diamond appear? Anyways, I called its bet and won the $120 pot when it flipped over J9 for three of a kind, which it had decided to turn into a massive bluff-raise. Fire sale! Snowie labeled my call as a huge blunder (ranking the king-high flush’s showdown strength as only a 0.59 out of 2.00).
3. In this hand, I had AK on the button and raised to $3. Snowie re-raised to $9, which I re-re-raised to $18. Snowie re-re-re-raised to $54 and I called. Snowie flagged my call as a huge mistake, saying I should have raised yet again. The flop came 658 with two clubs we both checked. The turn brought a third club and Snowie bet $54 and I folded. Evidently, it had a wider range than I imagined with all of that pre-flop raising, as it turned out to only have a KQ (with the king of clubs) which it had turned into a semi-bluff on the turn to take the pot. I can’t say I’ve seen many people 5-bet before the flop with King-high, so I’m still not sure about the “6-bet with AK” idea.
I’m happy to have defended humanity’s honor once again, but my confidence that PokerSnowie will take over the world was shaken a bit by its performance. If the “fire sale” strategy is a big part of its gameplan, it may still be a few years and AI upgrades before it can take down a top human.
So I lied. Regression to the mean isn’t everywhere. If something is measured or tested and has no element of chance involved, it will remain consistent. For example, if you’re repeatedly measuring people’s shoe sizes or heights. Unlike hair, you don’t really have a “bad height day.” (However, as a challenge to see if you’ve really grokked the previous blog entries, see if you can explain why children of really tall parents don’t usually match their height, despite the fact that people are generally getting taller.) What I’m getting at is that regression to the mean is directly related to the amount of luck involved in the initial result or measurement.
This means that you’ll see the greatest amount of regression when the measured outcome was completely due to luck. Unfortunately, you cannot tell if this is the case by looking at the stats alone. You can only suspect it because the result was surprising, was from one of a large number of experiments (data-mining), or was from a test that was re-run many times.
By the way, before I continue, for those of you who are hoping I bring up “informative priors” or eventually will discuss R, Python, or Hadoop, let me state for the record that I intend for this blog to be interesting to general readers and is therefore decidedly non-wonky. If you’re looking into a career in data science and want a good overview of the technical skill-set you should develop, allow me to refer you to a great slideshow on the topic by my friend and professor at USC, Saty Raghavachary.
Okay, so when you should you be a skeptic and raise your eyebrows at a test result? Consider this case study: we experimented with four different colors of the same landing page on our parked domains. After a few weeks, it was determined that there was no significant difference between the landers in terms of revenue per visitor. However, at the meeting when this conclusion was reported, our boss then asked “well, what if we look at the results by country?” I disapprovingly shook my head, knowing that I was witnessing a data foul in action. Sure enough, the testing analyst dug into the data and found that…
England prefers the teal lander!
At this point, eyebrows should go up. First of all, we didn’t run the test to find out what England’s favorite colored lander is. This might seem like a nit-pick, since we ran the test and happen to have results for England, but basically, there’s no reason to think that England is any different than any other country in terms of color preference. So there should be a check-mark by the “surprising result” category. Also, for the aggregate result to be break-even, there must be an “anti-England” country or countries out there who hate teal enough to offset them.
Any other “data fouls” here? Yes: this result is one of a large number of experiments and therefore needs to be validated. Even though we only ran one test, by breaking down the results by country, we effectively turned one test into a hundred tests. That matters, because when you determine “significance” at the 0.05 level, you’re basically saying that 5 times out of a hundred, you will see a random result that looks identical to this. So, how can you tell if this wasn’t one of those five cases?
I convinced my co-workers that data fouls were being committed, so we chose not to roll-out our new teal variation in England until we saw further evidence. Sure enough, the results suddenly reversed, to the point that teal was significantly worse than our standard color in England over the next few weeks.
A great illustration of this concept is the story of the stock-picker mail scam: A scammer sends out a letter to 1024 people, he tells 512 of them that a stock is going to go up that month and he tells the other half that it’s going to go down. The next month, he only continues writing to the 512 to whom he gave the correct prediction. He tells 256 of them that the stock will go up this time and 256 of them that it will go down. He repeats the same thing the next couple months for 128 of them and then 64. After that, for 32 people, they have received a correct stock prediction every month for the last 5 months. The chances of flipping heads 5 times in a row is 3.125%, so this would satisfy the 0.05 confidence level if any of them happen to be data wonks! Of course, that last letter states that if they want to continue getting the stock picks, they need to pony up some cash. As the recipient of the letter, if you have no evidence of anyone getting incorrect picks, you can’t just do the math to determine if the scammer actually can predict the future of that stock. Sometimes you just need a Spidey Sense in order to suspect that a data foul has been committed.
This is actually a recurring problem with science publishing these days. There’s a phenomenon called “truth decay” which refers to the fact that many studies are published and then are likely to be contradicted by future studies. Part of the reason for this is that interesting studies are the ones that are more likely to be published, which usually means that they’re surprising and and are therefore less likely to be true (and no, I’m not going to use the words “informative prior”!) There may be many previous experiments that showed the opposite result that weren’t published because they only confirmed what people already believed to be true. What’s noteworthy about that? Even worse, an experimenter can repeat an experiment or data-mine in private and present the result as if no data fouls were committed! It’s important to know whether they tortured their data in order to get desired results.
Sometimes, problems can occur simply because many independent scientists have an interest in answering the same question. If one of them finds a concerning result that the others didn’t find, guess which study you’re going to hear about? An example that drives me crazy is the controversy about aspartame, “one of the most thoroughly tested and studied food additives [the FDA] has ever approved.” In addition to the fact that there’s a body of evidence showing that it’s perfectly safe, remember that it’s replacing sugar, which isn’t exactly a health food. These types of situations put scientists in a tough spot, because science never says “okay, we’re 100% sure it’s fine now.” However, from a practical point of view, people should at some point should accept the consensus and worry about other things, like texting and driving. In fact, there’s probably someone out there behind the wheel right now texting to their friend about how dangerous aspartame is and that they should be sucking down 150 calories of liquefied sugar instead. When someone digs the cell-phone out of the wreckage, it will have this sentence still waiting to be sent: “NutraSweet has only been around since 1965, they don’t know what happens after FIFTY…”
Another fear that seems to live forever is the idea that cell phone usage causes brain cancer. Despite the fact that any physicist can tell you that radiation of that frequency is non-ionizing and therefore has no known mechanism by which it can harm you, public fear drives scientists to test and re-test and re-test until one of them eventually finds that there may be a concern, which drives more fear and more studies! It seems like a harmless endeavor to simply run experiments, but the problem arises when there are so many studies that the usual standards of significance do not imply meaningfulness of results. If you’re still worried about stuff like this, I think it helps to suppose there is a risk and then imagine what the impact would be in the world. I’m pretty sure you’re not thinking it would look like this chart from the link above…
Until there’s a worldwide spike in brain cancer, I just don’t see the point in worrying about this.
Once, when I hesitated to unleash an automated optimization program across the network without first doing a controlled test, my boss asked “What are you saying? It’s not going to find significance?” and I quipped “oh, it will find significance. It just won’t be significant.”