So I lied. Regression to the mean isn’t everywhere. If something is measured or tested and has no element of chance involved, it will remain consistent. For example, if you’re repeatedly measuring people’s shoe sizes or heights. Unlike hair, you don’t really have a “bad height day.” (However, as a challenge to see if you’ve really grokked the previous blog entries, see if you can explain why children of really tall parents don’t usually match their height, despite the fact that people are generally getting taller.) What I’m getting at is that regression to the mean is directly related to the amount of luck involved in the initial result or measurement.
This means that you’ll see the greatest amount of regression when the measured outcome was completely due to luck. Unfortunately, you cannot tell if this is the case by looking at the stats alone. You can only suspect it because the result was surprising, was from one of a large number of experiments (data-mining), or was from a test that was re-run many times.
By the way, before I continue, for those of you who are hoping I bring up “informative priors” or eventually will discuss R, Python, or Hadoop, let me state for the record that I intend for this blog to be interesting to general readers and is therefore decidedly non-wonky. If you’re looking into a career in data science and want a good overview of the technical skill-set you should develop, allow me to refer you to a great slideshow on the topic by my friend and professor at USC, Saty Raghavachary.
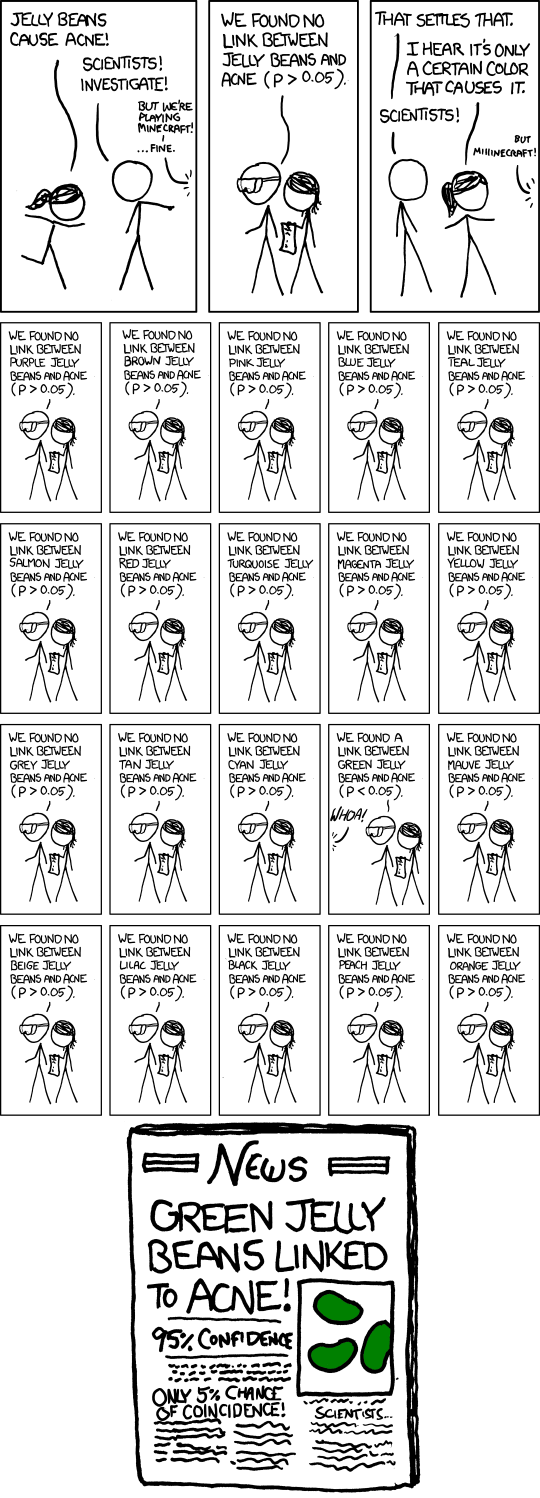
Okay, so when you should you be a skeptic and raise your eyebrows at a test result? Consider this case study: we experimented with four different colors of the same landing page on our parked domains. After a few weeks, it was determined that there was no significant difference between the landers in terms of revenue per visitor. However, at the meeting when this conclusion was reported, our boss then asked “well, what if we look at the results by country?” I disapprovingly shook my head, knowing that I was witnessing a data foul in action. Sure enough, the testing analyst dug into the data and found that…
England prefers the teal lander!
At this point, eyebrows should go up. First of all, we didn’t run the test to find out what England’s favorite colored lander is. This might seem like a nit-pick, since we ran the test and happen to have results for England, but basically, there’s no reason to think that England is any different than any other country in terms of color preference. So there should be a check-mark by the “surprising result” category. Also, for the aggregate result to be break-even, there must be an “anti-England” country or countries out there who hate teal enough to offset them.
Any other “data fouls” here? Yes: this result is one of a large number of experiments and therefore needs to be validated. Even though we only ran one test, by breaking down the results by country, we effectively turned one test into a hundred tests. That matters, because when you determine “significance” at the 0.05 level, you’re basically saying that 5 times out of a hundred, you will see a random result that looks identical to this. So, how can you tell if this wasn’t one of those five cases?
I convinced my co-workers that data fouls were being committed, so we chose not to roll-out our new teal variation in England until we saw further evidence. Sure enough, the results suddenly reversed, to the point that teal was significantly worse than our standard color in England over the next few weeks.
A great illustration of this concept is the story of the stock-picker mail scam: A scammer sends out a letter to 1024 people, he tells 512 of them that a stock is going to go up that month and he tells the other half that it’s going to go down. The next month, he only continues writing to the 512 to whom he gave the correct prediction. He tells 256 of them that the stock will go up this time and 256 of them that it will go down. He repeats the same thing the next couple months for 128 of them and then 64. After that, for 32 people, they have received a correct stock prediction every month for the last 5 months. The chances of flipping heads 5 times in a row is 3.125%, so this would satisfy the 0.05 confidence level if any of them happen to be data wonks! Of course, that last letter states that if they want to continue getting the stock picks, they need to pony up some cash. As the recipient of the letter, if you have no evidence of anyone getting incorrect picks, you can’t just do the math to determine if the scammer actually can predict the future of that stock. Sometimes you just need a Spidey Sense in order to suspect that a data foul has been committed.
This is actually a recurring problem with science publishing these days. There’s a phenomenon called “truth decay” which refers to the fact that many studies are published and then are likely to be contradicted by future studies. Part of the reason for this is that interesting studies are the ones that are more likely to be published, which usually means that they’re surprising and and are therefore less likely to be true (and no, I’m not going to use the words “informative prior”!) There may be many previous experiments that showed the opposite result that weren’t published because they only confirmed what people already believed to be true. What’s noteworthy about that? Even worse, an experimenter can repeat an experiment or data-mine in private and present the result as if no data fouls were committed! It’s important to know whether they tortured their data in order to get desired results.
Sometimes, problems can occur simply because many independent scientists have an interest in answering the same question. If one of them finds a concerning result that the others didn’t find, guess which study you’re going to hear about? An example that drives me crazy is the controversy about aspartame, “one of the most thoroughly tested and studied food additives [the FDA] has ever approved.” In addition to the fact that there’s a body of evidence showing that it’s perfectly safe, remember that it’s replacing sugar, which isn’t exactly a health food. These types of situations put scientists in a tough spot, because science never says “okay, we’re 100% sure it’s fine now.” However, from a practical point of view, people should at some point should accept the consensus and worry about other things, like texting and driving. In fact, there’s probably someone out there behind the wheel right now texting to their friend about how dangerous aspartame is and that they should be sucking down 150 calories of liquefied sugar instead. When someone digs the cell-phone out of the wreckage, it will have this sentence still waiting to be sent: “NutraSweet has only been around since 1965, they don’t know what happens after FIFTY…”
Another fear that seems to live forever is the idea that cell phone usage causes brain cancer. Despite the fact that any physicist can tell you that radiation of that frequency is non-ionizing and therefore has no known mechanism by which it can harm you, public fear drives scientists to test and re-test and re-test until one of them eventually finds that there may be a concern, which drives more fear and more studies! It seems like a harmless endeavor to simply run experiments, but the problem arises when there are so many studies that the usual standards of significance do not imply meaningfulness of results. If you’re still worried about stuff like this, I think it helps to suppose there is a risk and then imagine what the impact would be in the world. I’m pretty sure you’re not thinking it would look like this chart from the link above…
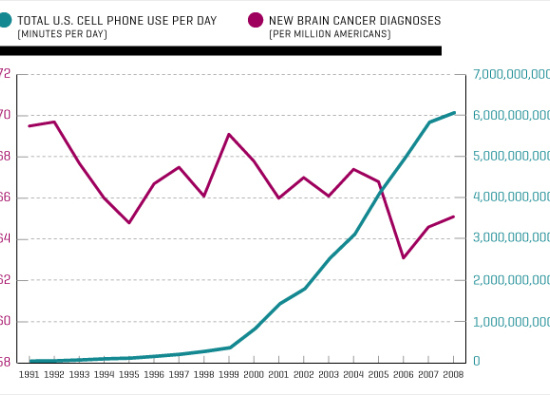
Until there’s a worldwide spike in brain cancer, I just don’t see the point in worrying about this.
Once, when I hesitated to unleash an automated optimization program across the network without first doing a controlled test, my boss asked “What are you saying? It’s not going to find significance?” and I quipped “oh, it will find significance. It just won’t be significant.”