Book Review: “Distrust – Big Data, Data Torturing, and the Assault on Science” by Gary Smith

The Battle for Science in the Age of Misinformation

In “Distrust – Big Data, Data Torturing, and the Assault on Science,” Gary Smith discusses the ills plaguing science and the public’s trust in it. The central theme is that science and scientific credibility are under attack on three fronts: internet disinformation, p-hacking, and HARKing (Hypothesizing After the Results are Known). These threats work together to compromise the reliability of scientific studies and to exacerbate the dwindling trust in its findings.

The internet has long been a double-edged sword; while it provides a platform for free expression and the collection of human knowledge, it’s also a petri dish for disinformation. Smith describes how falsehoods proliferate online, often accelerated by algorithms designed to prioritize engagement over accuracy. This phenomenon is particularly dangerous when tackling real-world challenges like COVID-19. Disinformation has led to widespread skepticism about science-backed interventions like vaccines. In this age of “fake news,” public trust in mass media has also taken a hit.

Real Science, Real Results

Gary Smith lauds the success of mRNA vaccines—a stellar example of science working as it should. With a 95% drop in infections reported in randomized trials, the vaccines developed by Pfizer-BioNTech and Moderna have proven to be nothing short of miraculous. Smith points out that these vaccines’ effectiveness is supported by solid data, contrasting the unsubstantiated claims made about hydroxychloroquine and ivermectin. This distinction between evidence-based medicine and wishful thinking underlines the importance of critical thinking and analytical rigor.

AI: A Story of Broken Promises

As usual, Smith brings a dose of reality to the overly optimistic world of artificial intelligence. After IBM’s Watson stole the spotlight by winning Jeopardy!, it was hailed as a future game-changer in healthcare diagnostics. However, the reality has been far less revolutionary. Smith dissects this failure, highlighting the critical weaknesses of AI. AI is not the impending super-intelligence it is often promoted to be, which is critical to understand as we navigate the ever-evolving landscape of AI technology.

[Side note: Gary and I have good-natured debates about the importance of ChatGPT. He argues that chatbots are “B.S. Generators” and that’s actually a fairly apt characterization. I used to work with a software developer who admitted that when he didn’t know the answer to a question the project manager was asking him, he would “blast him with bullshit, just BLAST him!” and by that, he meant that he’d just overwhelm him with technical-sounding jargon until he went away confused. Assuming that he wasn’t just choosing words at random, the technical jargon he blasted the manager with was probably something he’d heard or read somewhere. Sounds a bit like ChatGPT, doesn’t it?

However, there’s a difference. ChatGPT is using our prompts to find the most appropriate (and surprisingly grammatically correct) response. As Smith points out, chatbots don’t know what words mean or what the world is like, they’re just finding patterns in their training data and parroting back to us what people usually say. However, it’s not just nonsense; you could say that it’s giving us glimpses of the sum of human knowledge available as of 2021! Of course, information can be wrong on the internet, but ChatGPT is basically a linguistic interface that boils the entire web down to the essence of what you’re probably looking for. Contrast this with Google’s endless list of possibly helpful links or Wikipedia’s firehose of overly technical information… have fun trying to extract the answer for yourself! I think ChatGPT is revolutionary. It’s not actually intelligent, but it will save us countless hours and teach us things in the most efficient way possible: through question and answer sessions.

Regarding the downside of chatbot “hallucinations”, guess what: you should always be skeptical of what you read. If you Google the age of the universe right now, it gives you the speculations of a recent paper instead of the scientific consensus. Sometimes, when it’s important, you need to verify information. Chatbots are no better or worse than what people have said about your topic of interest on the internet. Most of the time, the “wisdom of the crowds” is fine. And it’s still up to you to figure out when it’s not.]

Smith often says that the danger is not that AI will get smarter than us, but that people will think AI is smarter than us and rely on it for things they shouldn’t. Smith uses the entertaining BABEL automatic essay generator as a cautionary tale about relying on algorithms. BABEL basically cranks out random nonsense, but uses a lot of big words, and gets scored highly by automated essay graders (yes, automated graders can be “blasted with B.S.”). It’s an amusing yet stark reminder that while technology has come a long way, it can still be gamed or manipulated. Smith uses this example to show the pitfall of over-reliance on AI for tasks that require nuanced understanding, an essential lesson for educators, data scientists, and policymakers alike.

The Disturbing Trend of Retracted Studies

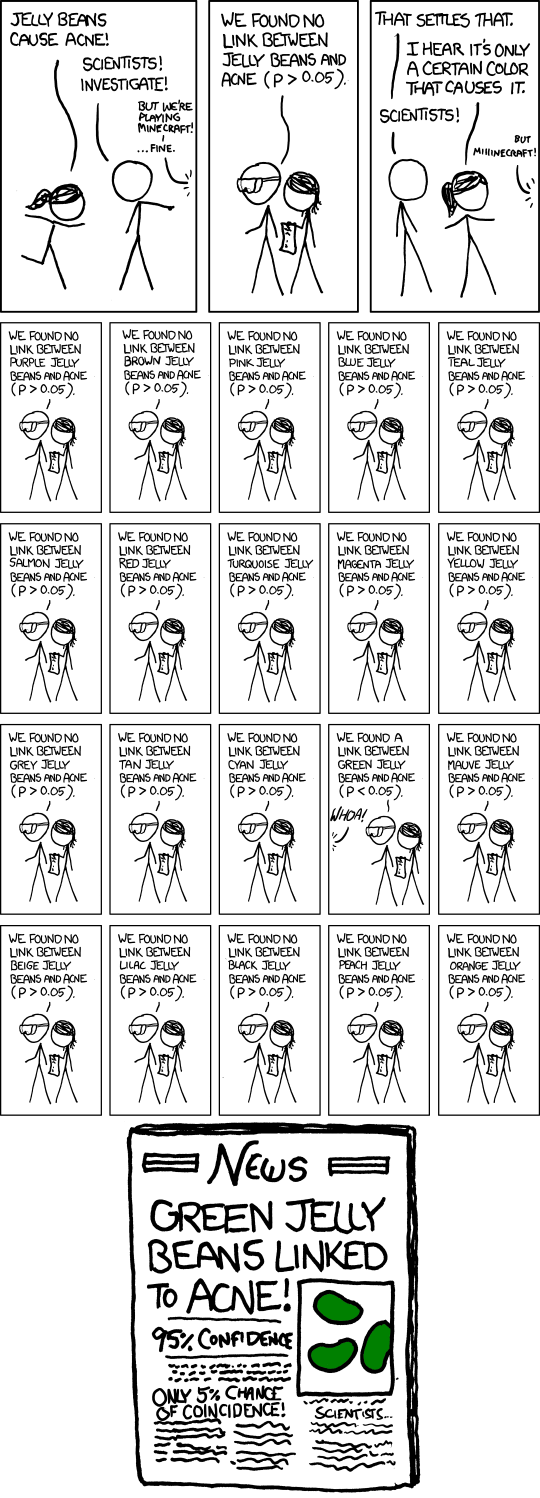
Smith doesn’t shy away from criticizing the scientific community itself, particularly the increasing rate of retracted papers. The integrity of the scientific process needs an upgrade. Retractions can shake public trust and, as Smith notes, signal a deeper issue with ‘p-hacking’ and ‘HARKing.’ These practices distort data and hypotheses to manufacture significance, undermining the credibility of entire fields of research. Smith exposes the incentives that lead to shoddy peer reviews and phony journals.

The concluding chapter, “Restoring the Luster of Science,” is a manifesto for renewing public trust in science. Smith exposes the downsides of “filter bubbles,” where algorithms shape our realities by reinforcing existing beliefs and biases. He also wrestles with the ethical implications of regulating speech to combat disinformation without infringing on civil liberties. This chapter serves as a summary of the book’s overarching themes and offers a pragmatic way forward for educators and policymakers.

I was particularly happy to see his last three recommended actions to help restore the luster of science:

      1. Courses in statistical literacy and reasoning should be an integral part of school curricula and made available online, too.
      2. Statistics courses in all disciplines should include substantial discussion of Bayesian methods.
      3. Statistics courses in all disciplines should include substantial discussion of p-hacking and HARKing.

I couldn’t agree more and in fact am currently working with Julia Koschinsky at the University of Chicago on designing a course that takes up the challenge: “Becoming a Data Scientist in the Age of AI – Developing Critical Skills Beyond Chatbots”.

Missed Opportunities

The book does leave a couple stones unturned. Smith understandably avoided the more thorny issues surrounding social media’s premature suppression of the COVID “lab leak” hypothesis (it got muddled up with the “intentional bioweapon” conspiracy theory) which could have added a nuanced layer to the discussion about regulating misinformation for public safety. The topic has been the subject of significant controversy and debate, particularly because it touches on complex issues involving science and politics. (Btw, the most entertaining defense of the hypothesis was undoubtedly this one by Jon Stewart).

The challenges that tech companies face with real-time content moderation, especially when dealing with rapidly evolving scientific matters where the truth is not easily discernable, are significant. There are ethical dilemmas related to freedom of speech versus public safety, debates about the responsibility of tech companies in moderating content, and questions about how we navigate “the truth” in an age overwhelmed by information and misinformation alike. There are no easy answers here, but it would be interesting to read how a thinker like Smith would navigate these murky waters.

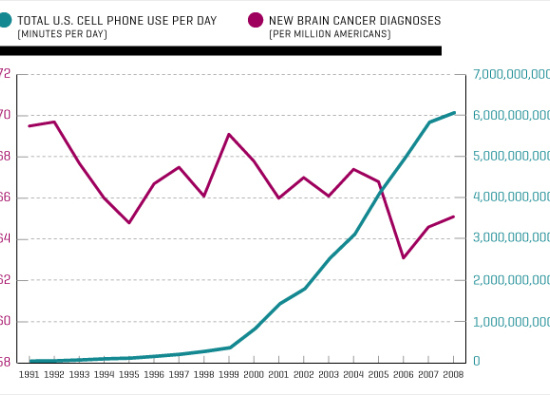
I also think the book missed a golden educational moment concerning reported vaccine efficacy…

Look closely at Smith’s tables below…

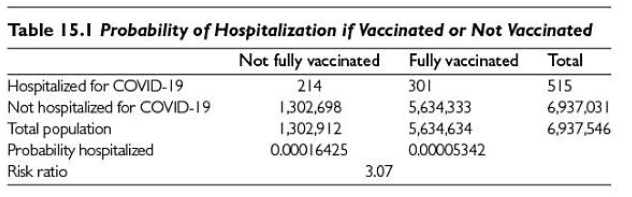
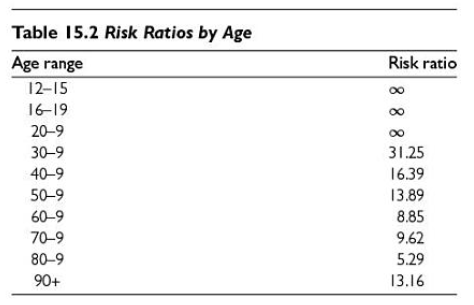
You may wonder how an overall odds risk ratio can be 3.07 when none of the risk ratios are that low when grouped by age!

Smith would instantly know the answer, but most of us wouldn’t. The majority of comparisons we see between vaccinated and unvaccinated look more like his first chart, with a 2-4x benefit of vaccination…

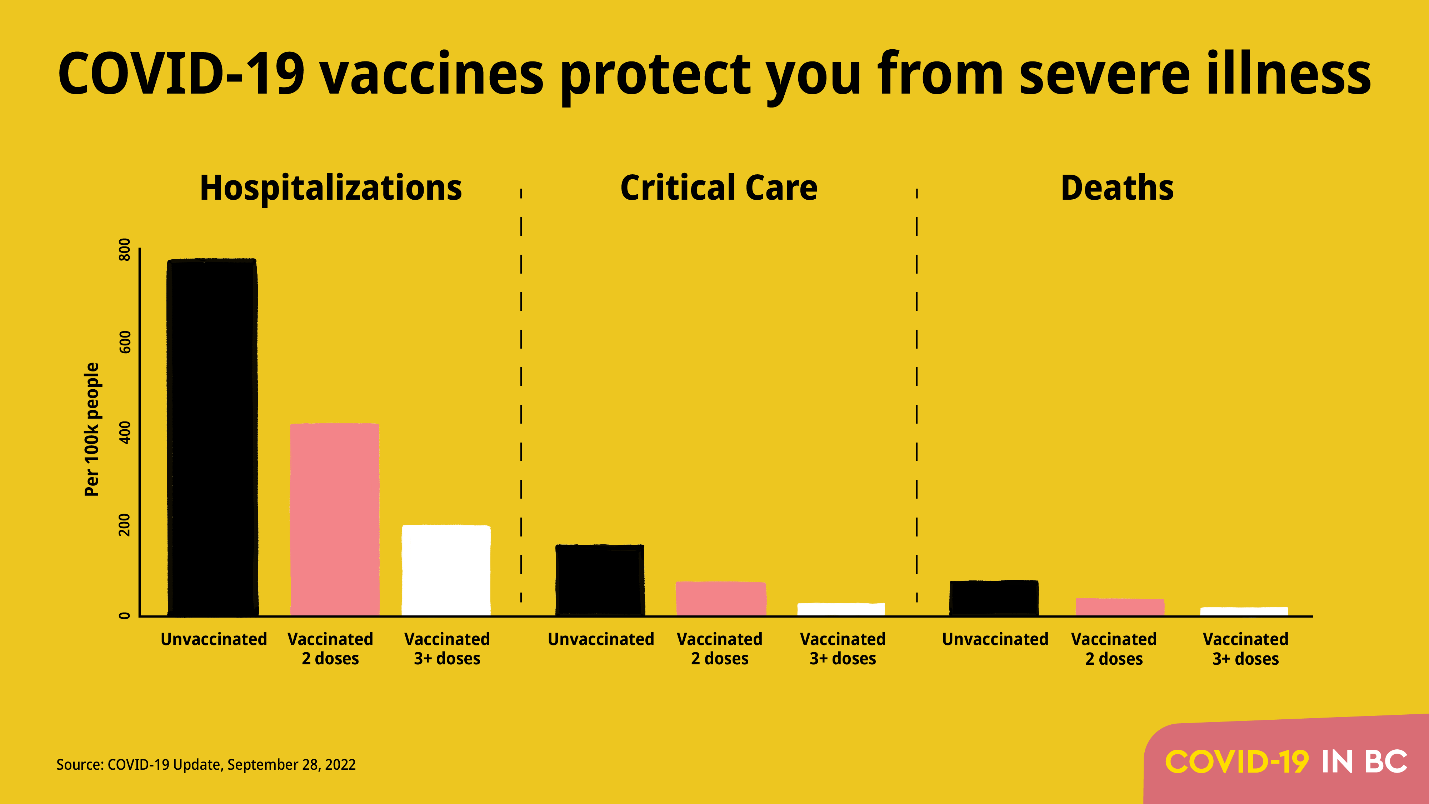
It’s a straight-forward comparison of the probability of hospitalization for vaccinated and unvaccinated people? What could be wrong with that?

It turns out that it’s very misleading to directly compare vaccinated people vs. unvaccinated people, because it’s not an apples to apples comparison! I’ll take a wild guess and say that the population of vaccinated people are more concerned about catching COVID-19. Specifically, they are more likely to be elderly, overweight, or have pre-existing conditions. That means that these simple comparisons between the two groups are greatly understating the benefit of vaccination! The reality (when controlling for age, as in Smith’s second chart) is more like this…

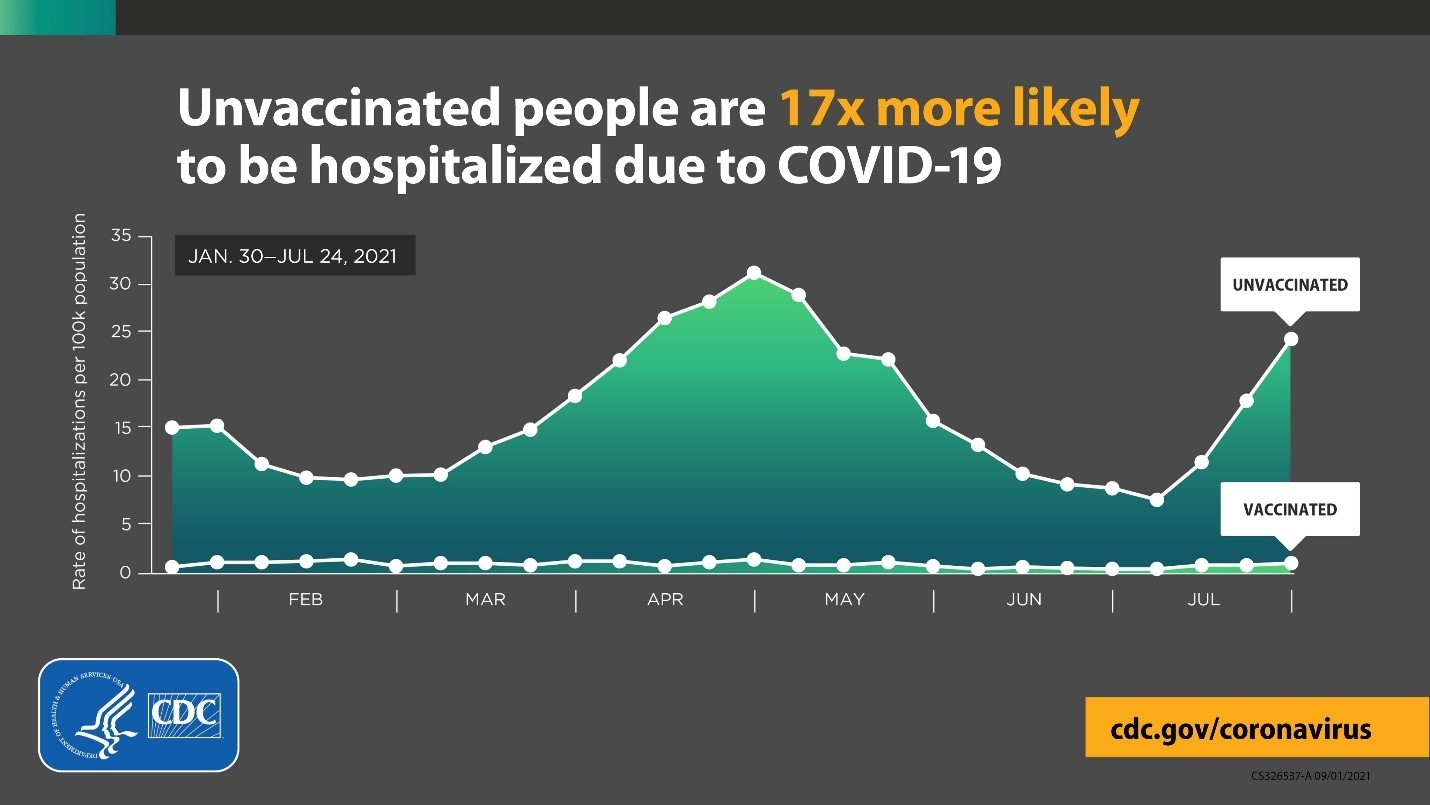
The CDC did their best to control for all of the variables, but even their analysis is probably understating the benefit, given the 19x improvement shown in the randomized controlled trials.

Conclusion

Gary Smith’s “Distrust – Big Data, Data Torturing, and the Assault on Science” is a timely, critical examination of the various threats to scientific integrity and public trust. It serves as both a warning and a guide, tackling complicated issues with nuance and depth. For anyone interested in science, data science, education, or public policy, this book is an invaluable resource for understanding the modern landscape of disinformation, scientific misdeeds, and the quest for truth.

The Vaccine Decision: Get It Right

Fortunately, there are very few decisions in life that can have truly catastrophic consequences if we get them wrong. The vast majority of choices we make are mundane and will not make any major difference either way. Whether or not the outcomes are predictable, let’s call these potentially catastrophic decisions “high variance” because they can have a major impact on your life. The high variance decisions are the ones you really need to get right.

In addition to categorizing decisions as high or low variance, you can also classify a decision by how simple or difficult it is. If you were to create pros and cons lists for a simple decision, it would have a clear imbalance in favor of one or the other, while difficult decisions have pros and cons lists that are balanced. The good news is that for the most difficult decisions, you can’t go very far wrong, no matter what you decide. Since the pros and cons are almost balanced, your expected happiness with future outcomes should be about the same either way. The simple decisions are the ones you really need to get right.

The outcome of a decision doesn’t make it good or bad – it is only a bad decision if the foreseeable consequences should have led you to make a different choice. If the consequences are not foreseeable, it wouldn’t count so much as a “bad” decision if things go badly, but rather as an “unfortunate” one. For example, you can’t really be blamed for riding the daily train to work, even if it ends up crashing. However, you CAN be blamed for driving drunk, even if you don’t crash, because it doesn’t take a crystal ball to see that the potential downside is much worse than the inconvenience of taking a taxi. You make good decisions if you reasonably consider the possible paths and follow the one with the best expected value, whether or not things pan out the way you’d hoped.

Passing up the COVID vaccine would be a very bad decision, because it is high variance, it is simple, and the potential devastating outcome is easy to foresee.

So how do we know it’s a simple decision? Let’s look at the cons list first: vaccination may have contributed to three deaths from a rare blood clot disorder. Oh yeah, and it might pinch a bit and lead to a few days of feeling under the weather. That’s it, that’s the list.

What about the vaccine causing COVID? Can’t happen. What about the unknown long-term effects? There’s no reason to believe this will be the first vaccine to ever have those. What about effects on fertility? That’s also nonsense. Where do you read this stuff? If you’ve come across these warnings, you may want to look into the reliability of your sources of information.

In order to fully appreciate the pros of vaccination, let’s get an intuitive feel for the risks involved by using the analogy of drawing specific cards from a deck of playing cards. Since there are 52 cards in a standard deck, the chances of drawing a particular card is about 2%. If you’ve ever tried to predict a specific card, you know that it’s very unlikely, but possible. I guarantee that you’ll fool Penn and Teller with your magic trick if you go up on stage, tell them to think of a specific card, and then just blurt it out. So, armed with a feel for how likely it is to draw cards from decks, let’s consider the risks you’ll face depending on whether or not you get vaccinated.

Option 1: Try Your Luck.

Let’s say you don’t believe that the universe is trying to kill you and you want to take your chances and see if you draw the hospital/death card from the deck. If you choose this path, it looks like a decent estimate for you catching COVID-19 at some point in the next year is about 1 in 10. Then, if you get infected, depending on your age and pre-existing conditions, the chances the disease lands you in the hospital, leaves you with long-term damage, or a slow agonizing death, is about 1 in 4. Since you multiply probabilities to find out the chances that two independent events both occur, your probability of drawing the hospital card should be approximately 0.10 * 0.25 = 2.5%, or a bit more than drawing one specific card from the deck. So, option 1 is to shuffle up that deck and try not to pull the hospital/death card, the Ace of Spades. You’ll probably be fine.

Figure 1: Good luck – Don’t draw the Ace of Spades!

Option 2: Trust Science.

The other option is to just do what the health experts say and get the shot. So what are the chances you go to the hospital for COVID-19 if you’re vaccinated? Well, if you’re under 65 and haven’t had an organ transplant or something that compromises your immune system, it’s effectively 0%. But that’s hard to visualize, so let’s just say you’re a truly random and possibly high-risk individual. As of July 12, there have been 5,492 vaccinated individuals hospitalized for COVID-19 symptoms out of the 159 million who have been vaccinated. So, about 0.003%. Let’s bump that up to 0.007% because we want to estimate the chances of landing in the hospital at some point in the next year. That’s 7 out of 100,000.

Figure 2: Okay, NOW try not to pick the bad card hidden in one of those decks!

You can do this same exercise if you’re under 65 and have a good immune system by just imagining that there’s no bad card.

Get this one right; you may never see a simpler, higher variance decision in your life.

Over testing, data torture, and other data fouls

So I lied.  Regression to the mean isn’t everywhere.  If something is measured or tested and has no element of chance involved, it will remain consistent.  For example, if you’re repeatedly measuring people’s shoe sizes or heights.  Unlike hair, you don’t really have a “bad height day.”  (However, as a challenge to see if you’ve really grokked the previous blog entries, see if you can explain why children of really tall parents don’t usually match their height, despite the fact that people are generally getting taller.)  What I’m getting at is that regression to the mean is directly related to the amount of luck involved in the initial result or measurement.

This means that you’ll see the greatest amount of regression when the measured outcome was completely due to luck.  Unfortunately, you cannot tell if this is the case by looking at the stats alone.  You can only suspect it because the result was surprising, was from one of a large number of experiments (data-mining), or was from a test that was re-run many times.

By the way, before I continue, for those of you who are hoping I bring up “informative priors” or eventually will discuss R, Python, or Hadoop, let me state for the record that I intend for this blog to be interesting to general readers and is therefore decidedly non-wonky.  If you’re looking into a career in data science and want a good overview of the technical skill-set you should develop, allow me to refer you to a great slideshow on the topic by my friend and professor at USC, Saty Raghavachary.

Okay, so when you should you be a skeptic and raise your eyebrows at a test result?  Consider this case study: we experimented with four different colors of the same landing page on our parked domains.  After a few weeks, it was determined that there was no significant difference between the landers in terms of revenue per visitor.  However, at the meeting when this conclusion was reported, our boss then asked “well, what if we look at the results by country?”  I disapprovingly shook my head, knowing that I was witnessing a data foul in action.  Sure enough, the testing analyst dug into the data and found that…

England prefers the teal lander!

At this point, eyebrows should go up.  First of all, we didn’t run the test to find out what England’s favorite colored lander is.  This might seem like a nit-pick, since we ran the test and happen to have results for England, but basically, there’s no reason to think that England is any different than any other country in terms of color preference.  So there should be a check-mark by the “surprising result” category.  Also, for the aggregate result to be break-even, there must be an “anti-England” country or countries out there who hate teal enough to offset them.

Any other “data fouls” here?  Yes: this result is one of a large number of experiments and therefore needs to be validated.  Even though we only ran one test, by breaking down the results by country, we effectively turned one test into a hundred tests.  That matters, because when you determine “significance” at the 0.05 level, you’re basically saying that 5 times out of a hundred, you will see a random result that looks identical to this.  So, how can you tell if this wasn’t one of those five cases?

I convinced my co-workers that data fouls were being committed, so we chose not to roll-out our new teal variation in England until we saw further evidence.  Sure enough, the results suddenly reversed, to the point that teal was significantly worse than our standard color in England over the next few weeks.

A great illustration of this concept is the story of the stock-picker mail scam:  A scammer sends out a letter to 1024 people, he tells 512 of them that a stock is going to go up that month and he tells the other half that it’s going to go down.  The next month, he only continues writing to the 512 to whom he gave the correct prediction.  He tells 256 of them that the stock will go up this time and 256 of them that it will go down.  He repeats the same thing the next couple months for 128 of them and then 64.  After that, for 32 people, they have received a correct stock prediction every month for the last 5 months.  The chances of flipping heads 5 times in a row is 3.125%, so this would satisfy the 0.05 confidence level if any of them happen to be data wonks!  Of course, that last letter states that if they want to continue getting the stock picks, they need to pony up some cash.  As the recipient of the letter, if you have no evidence of anyone getting incorrect picks, you can’t just do the math to determine if the scammer actually can predict the future of that stock.  Sometimes you just need a Spidey Sense in order to suspect that a data foul has been committed.

This is actually a recurring problem with science publishing these days.  There’s a phenomenon called “truth decay”  which refers to the fact that many studies are published and then are likely to be contradicted by future studies.  Part of the reason for this is that interesting studies are the ones that are more likely to be published, which usually means that they’re surprising and and are therefore less likely to be true (and no, I’m not going to use the words “informative prior”!)  There may be many previous experiments that showed the opposite result that weren’t published because they only confirmed what people already believed to be true.  What’s noteworthy about that?  Even worse, an experimenter can repeat an experiment or data-mine in private and present the result as if no data fouls were committed!  It’s important to know whether they tortured their data in order to get desired results.

Sometimes, problems can occur simply because many independent scientists have an interest in answering the same question.  If one of them finds a concerning result that the others didn’t find, guess which study you’re going to hear about?  An example that drives me crazy is the controversy about aspartame, “one of the most thoroughly tested and studied food additives [the FDA] has ever approved.”  In addition to the fact that there’s a body of evidence showing that it’s perfectly safe, remember that it’s replacing sugar, which isn’t exactly a health food.  These types of situations put scientists in a tough spot, because science never says “okay, we’re 100% sure it’s fine now.”  However, from a practical point of view, people should at some point should accept the consensus and worry about other things, like texting and driving.  In fact, there’s probably someone out there behind the wheel right now texting to their friend about how dangerous aspartame is and that they should be sucking down 150 calories of liquefied sugar instead.  When someone digs the cell-phone out of the wreckage, it will have this sentence still waiting to be sent: “NutraSweet has only been around since 1965, they don’t know what happens after FIFTY…”

Another fear that seems to live forever is the idea that cell phone usage causes brain cancer.  Despite the fact that any physicist can tell you that radiation of that frequency is non-ionizing and therefore has no known mechanism by which it can harm you, public fear drives scientists to test and re-test and re-test until one of them eventually finds that there may be a concern, which drives more fear and more studies!  It seems like a harmless endeavor to simply run experiments, but the problem arises when there are so many studies that the usual standards of significance do not imply meaningfulness of results.  If you’re still worried about stuff like this, I think it helps to suppose there is a risk and then imagine what the impact would be in the world.  I’m pretty sure you’re not thinking it would look like this chart from the link above…

cellphone_use_vs_brain_cancer2

Until there’s a worldwide spike in brain cancer, I just don’t see the point in worrying about this.

Once, when I hesitated to unleash an automated optimization program across the network without first doing a controlled test, my boss asked “What are you saying?  It’s not going to find significance?” and I quipped “oh, it will find significance.  It just won’t be significant.”

StatsCartoon