A Data Scientist Looks at Poker Data Part 2

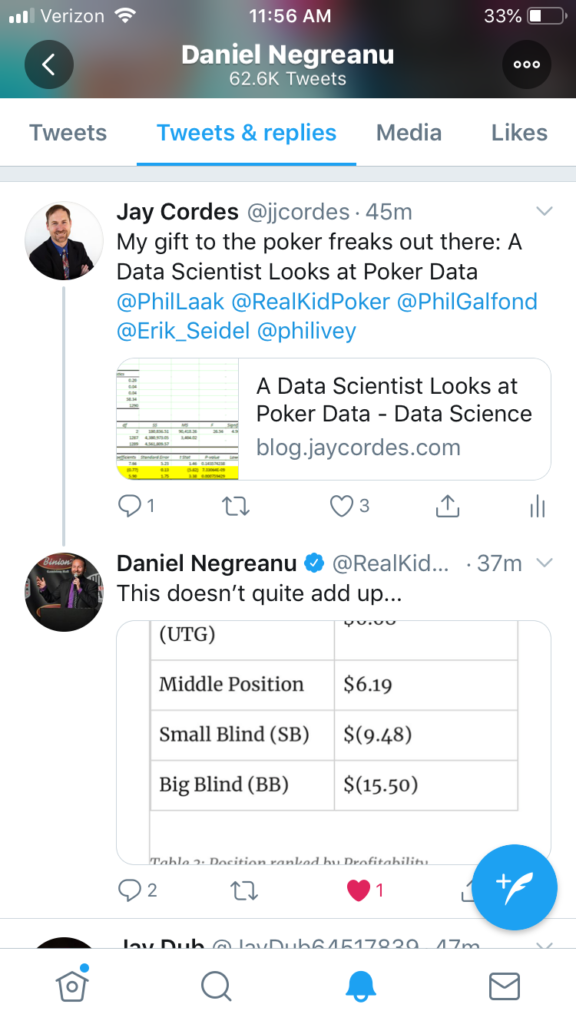
Okay, so now that the president has shown us that COVID-19 is a piece of cake as long as you have a tiger blood transfusion at the ready, we can focus on more important things: I’m honored to say that poker legend Daniel Negreanu glanced at my last blog entry and … said that it didn’t add up.

Figure 1: That is correct, sir. They don’t add up, and it’s my bad for making it look like they should.

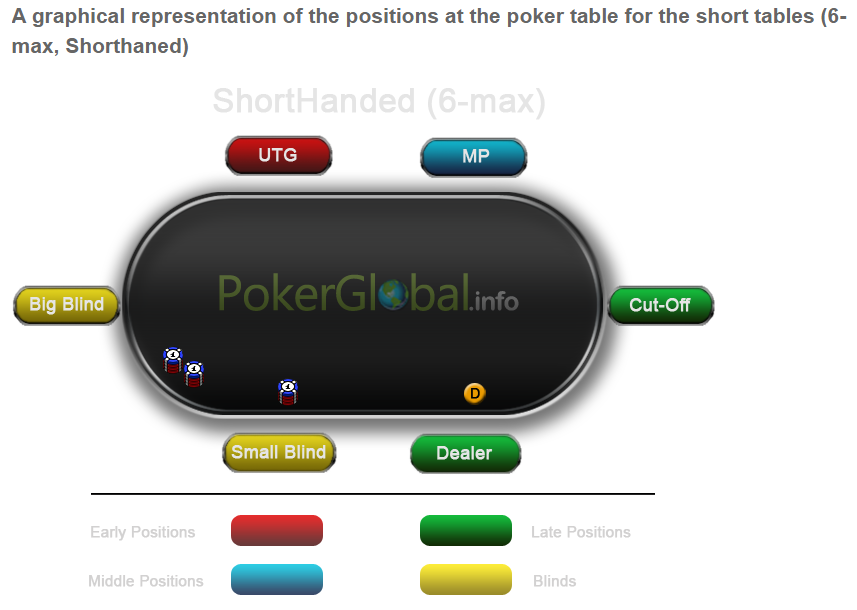
I displayed the total stats by position, summarizing the data to just show the aggregates without any filtering or funny stuff. Nothing to explain, right? It’s the total profitability for each of the positions at the 6-max tables.

The problem is, as my friend pointed out, “shouldn’t you use only the data for full tables? Apples and oranges, otherwise.” What do you think? Here’s my original table, which is the total profit for each position divided by the total hands played from each position…

PositionSuccess (profit per hand)
Button$11.09
Cutoff$6.85
Under the Gun (UTG)$6.68
Middle Position$6.19
Small Blind (SB)$(9.48)
Big Blind (BB)$(15.50)
Table 1: The original table of profit by position. Do you see what Daniel saw?

If you’re assuming that each position was played the same number of times, there’s a big problem: the numbers add up to an average profit greater than zero! Poker sites don’t run for free, and they certainly don’t give away more money than they take in. The numbers aren’t wrong, but an assumption is; every hand dealt has a big blind, but not every hand played has an Under the Gun player (there are often seats empty at the table). Allow me to present a new version of the table with profit by position only when the table is full:

PositionSuccess (profit per hand)
Button$10.92
Cutoff$7.53
Under the Gun (UTG)$6.54
Middle Position$5.17
Small Blind (SB)$(11.03)
Big Blind (BB)$(20.21)
Table 2: Better table. Profit by position WHEN ALL 6 SEATS ARE TAKEN

Even though this table is based on less data, it lines up better with expectations. If you add up the numbers now, you get -$1.07, which is the average rake (it ranges from $0 to $3). The ranking of the seats by profitability is still the same, even with that odd quirk of UTG being more profitable than the middle position, despite being a worse position. However, you’ll notice that the increase in profitability is smoother. The dealer position is no longer so unusually profitable (the dealer’s relative advantage evidently grows as the number of opponents decreases) while all of the other non-blind positions are about the same. The takeaway lesson is this: make sure you’re showing people what they’re expecting; don’t just show aggregate numbers for the entire dataset as a matter of principle.

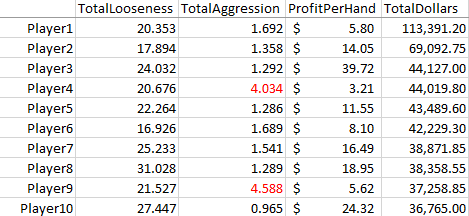
Anyway, recall that last time, we found that, overall, the top 10 players (by total profit) were tighter and more aggressive than the bottom 10 players. Let’s look more closely at how the top 10 vs. the bottom 10 played when the tables were full. The top players pocketed a total of $508,000 ($8.35 per hand), while the bottom players lost $338,000 (-$10.84 per hand).

Another thing you’d expect to see from good players is a better ability to manage “tilt”, which is when people’s emotions get out of control and they’re unable to continue playing their “A game” after a big loss. Since we’re looking at data for $50 big blind tables, let’s call a big loss one that exceeds $1000. This happened less than 1% of the time for the biggest winners, so it’s pretty rare.

According to a paper co-authored by my professor buddy Gary Smith, “…experienced poker players typically change their style of play after winning or losing a big pot—most notably, playing less cautiously after a big loss, evidently hoping for lucky cards that will erase their loss.”

As a group, the biggest winners played 20.7% of their hands in the following round (6 hands dealt) after a big loss, while the biggest losers played 35.3%! That’s a dramatic difference, especially when you consider that the looseness in general (not preceded by big wins or losses) for these groups was 21.1% and 28.1%, so the top players displayed no tilt at all, while the bottom players went a bit crazy. After a big loss, the loss per hand for the bottom players more than doubled ($-9.43 to $-23.20 per hand).

Normal Loose %Normal ProfitLoose % after big lossProfit after big lossLoose % after big winProfit after big win
Top 1021.1%$8.5920.7%$6.9319.8%$5.79
Bottom 1028.1%($9.43)35.3%($23.20)32.7%($11.59)
Table 3: Top players stay closer to their “A game” after big wins or losses.

So, what about hand ranges? We know that top players are more selective, but what specifically does that mean? As I started looking through sample hands for the top players, I noticed that an unusual number of them were making aggressive plays because they were short-stacked (had less than $1000 when the blinds are $25/$50). There were a lot of hands where someone would raise before the action got to them and they would just respond with an all-in, especially if the raise came from the button…

Hand Information
Game: No Limit
Blind: $25/ $50
Hand History converter courtesy of pokerhandreplays.com

Table Information
Seat1:   Player 1   ($5,172)Big Blind
Seat2:   Player 2   ($5,250)
Seat3:   Player 3   ($7,630)
Seat4:   Player 4   ($5,222)
Seat5:   Player 5   ($16,680)Dealer
Seat6:   Player 6   ($1,000)Small Blind
Dealt to Player 6


Preflop (Pot:75)
Player 2   FOLD    
Player 3   FOLD    
Player 4   FOLD    
Player 5   RAISE    $175
Player 6   ALL-IN    $975
Player 1   FOLD    
Player 5   CALL    $825

Flop   (Pot: $2,050)


Turn   (Pot: $2,050)


River   (Pot: $2,050)


Showdown:

Player 6  SHOWS

Player 5  SHOWS

Player 6  wins the pot: $2,050

(Note: the all-in raise was to $1000, but $25 was already in the pot from the SB)

Then I realized there were a LOT of hands like this and that they were primarily from two of the ten players. Sure, enough, when I looked more closely, it turned out that they were buying in as short-stacks, doubling up, and then switching tables, only to buy-in as short-stacks again – a strategy described as “hit and run” or “rat-holing”, which can be a surprisingly profitable and annoying strategy in cash-games.

Because people think of short-stacks as being in a position of weakness in tournaments, many don’t realize that it’s actually a strategic advantage in cash games (well, the pros do, which is why they’re generally not fans of rat-holers). Not only is it relatively simple to play (often, it’s just one all-in re-raise before the flop), it puts the bigger stacks in very awkward positions. Sometimes, they’re basically forced mathematically to call a bet, even if they suspect they have the worst of it.

Consider the hand above, but suppose the short-stack player (QJs) showed his hand as he went all-in, so the original raiser (44) could make a perfectly informed decision. The decision that 44 faced was whether or not to call another $825 for a chance at $2050. Since $825 / $2050 is 40.24%, a Hold’em Calculator tells us that it’s a clear call (44 vs. QJs has a 48% chance of winning). By making the correct call here, the original raiser can expect to win 48% * $2050 = $984 (hence, “pos EV” or positive expected value for the call). That’s a good amount better than the $825 it cost to call the bet, but it’s worse than if the player had just sat out the hand and never had to shell out $1000 for the experience. And this was in the case where the short-stack player had a mediocre hand! Often, an all-in from the blinds here means a medium or high pair, in which case the raiser would win less than 20% of the time. So, the call is not automatic by any means! In summary, when an initial raiser gets shoved on by a short-stack, they’re put in a very tough spot in which they’re just trying to lose as little of their money as possible.

From an earlier life, I know a bit about this short-stack style of play (shhh!) so I wasn’t completely surprised to see two short-stackers in the list of the top 10 most profitable players. They weren’t as profitable per hand as the others top players, but they made up for it with volume (often being a short-stack is so easy to play, you can play many tables simultaneously). Most notably, the short-stackers were MUCH more aggressive than the other players, due to the large number of all-ins and relatively few check/call type hands…

Sing it: Which of these players are not like the others?

Since these players truly had a distinctive style, I lumped them together; let’s call them a prototypical successful short-stacker. Here’s what I found:

Under the Gun: When seated in the worst position, they showed down the following hands (recall that “AKs” means Ace-King suited, while “KJo” means King-Jack offsuit):

[A A][Q Q][T T][9 9][5 5][AKs][AQs][ATo][KJo]

Assuming that they chose their playable hand range according to how well they rank against a random hand in a showdown, this looks like about the top 14% of possible hands (55 is the worst hand in the group by this metric, winning only 60.32% vs. a random hand, so their range would include each hand type down to “55” at the link above). This is significantly tighter than the typical player UTG (20%), so if you see an experienced short-stack player raising from UTG, you’ve been warned about what you’re up against!

[Note: if you want to figure out the top x% range yourself, just put your list of ranked hand types in Excel with a column next to them showing the number of ways to get dealt each type of hand. Card combinatorics tell us that pairs can happen 6 ways, suited cards 4 ways, and unsuited non-pairs can be dealt 12 ways. If you include all possible hand types in your list, the “ways” column should add up to 1326, the total number of different two-card poker hands. Now, you can calculate the total “ways” for the set of hands you’re interested in, divide it by 1326, and you’ve got your percentage!]

Middle Position: In this position, they showed down a wider range:

[A A][Q Q][J J][8 8][T T][7 7][AKs][AJs][A7s][A6s][AKo][AQo][AJo][ATo][A9o][KJo][QJo]

This looks like the top 20% hands (every hand above QJo here). Hmm, 5 players left in the hand, 1 in 5 = 20%? It’s possible these players didn’t base their playable hand ranges on historical data, but rather just on the number of opponents left to act (in which case they may actually play 1/6 = 16.7% of their hands from UTG).

A typical hand (player 4 is the short-stacker)…

Hand Information
Game: No Limit
Blind: $25/ $50
Hand History converter courtesy of pokerhandreplays.com

Table Information
Seat1:   Player 1   ($1,366)Small Blind
Seat2:   Player 2   ($6,643)Big Blind
Seat3:   Player 3   ($5,729)
Seat4:   Player 4   ($1,297)
Seat5:   Player 5   ($1,159)
Seat6:   Player 6   ($14,769)Dealer
Dealt to Player 4


Preflop (Pot:75)
Player 3   FOLD    
Player 4   RAISE    $100
Player 5   FOLD    
Player 6   CALL    $100
Player 1   FOLD    
Player 2   RAISE    $400
Player 4   ALL-IN    $1,197
Player 6   FOLD    
Player 2   CALL    $897

Flop   (Pot: $2,769)


Turn   (Pot: $2,769)


River   (Pot: $2,769)


Showdown:

Player 4  SHOWS

Player 2  SHOWS

Player 4  wins the pot: $2,769

You can see why the aggression rating for these guys is off the charts. When dealt a pair and playing with a short-stack, it doesn’t make sense to call a raise and hope to hit a set, because the pot size won’t be big enough to justify the gamble. In this case, the short-stacker correctly predicted that the hand would be a coin flip, so he bet $800 for an even chance at $2800.

Cutoff Position: They showed a similar range here, so it looks like top 20% again…

[A A][K K][Q Q][T T][9 9][5 5][3 3][AKs][AQs][AKo][AQo][KJo][KTo][AJo][ATo][KQs][KTs]

The only hand outside of the top 20% here is 33, which only wins 53.69% vs. a random hand. It’s just hard to fold pairs!

Dealer Position: Here’s where their ranges really opened up. It looks to me like they could be raising with any above-average hand…

[A A][Q Q][T T][7 7][4 4][3 3][AKs][AQs][AJs][A7s][A6s][AKo][AQo][AJo][ATo][A9o][A7o][K5s][KQo][J7s][98o]

The loosest hands here are 98 offsuit (48.1% vs. random hand!) and J7 suited (52.32% vs. random hand).

Blinds: The sample hand at the beginning of this article shows that they will re-raise all-in out of the blinds even with a hand like QJ suited, which barely makes the top 20%, so it appears that they’re expecting other players to be just as loose as they are with their button raises. Here’s the whole set of hands they re-raised out of the blinds with…

[A A][K K][Q Q][J J][T T][9 9][8 8][7 7][6 6][5 5][4 4][2 2][AKs][AQs][AJs][ATs][A9s][A7s][A6s][AKo][AQo][AJo][ATo][A9o][A8o][A6o][A5o][K7s][KQo][KJo][KTo][QJs][T7s][T9s][98s]

In summary, they’re playing tighter than normal in the early position, looser than normal from the button, and much more aggressive than other profitable players. If they’re not in the blinds and someone raises before them, they typically push all-in with the top 10% of dealt hands. This is consistent with their overall strategy: find spots where (based on very limited information) they think they have an above average hand against their opponent’s range and then shove all of their chips in and hope for the best. It’s a pretty simple approach, and worked well ($80k profit in a few months for the two of them at the $25/$50 tables isn’t bad!)

If you’re new to poker, I’d recommend buying in with a short-stack and playing selectively and aggressively like these guys. The deeper the stacks, the more complicated the game gets and the more vulnerable you are against the more experienced opponents. If you don’t have many chips and Daniel Negreanu raises pre-flop and you push all-in on him, it doesn’t matter that he’s ten times better than you. He has to decide whether to call or fold and can’t bluff you out. Be warned however: he might have read this article and you may not be happy when he flips over his cards!

A Data Scientist Looks at Poker Data

So, are you tired of arguing about things like whether or not the CDC stated that only 6% of the official deaths were due to COVID-19? Me too. (By the way, the easiest way to show that, if anything, the death count is an underestimate is to point out that the excess deaths in the U.S. this year are at about 250,000. Why would that be, if not for COVID-19?)

Figure 1: Where did all the extra deaths come from if COVID-19 is overcounted?

Well, you’re in luck, because this article is not going to talk about the pandemic (anymore). Let’s all take a break from the daily death toll and the decline of democracy and talk about POKER.

Well, not just about poker, but also about how to approach historical data and carefully draw conclusions from it. There’s no surefire way to answer questions without controlled and randomized experiments, but that doesn’t mean that observational data is worthless. The goal when digging into historical data is to not fool yourself. You need to determine which patterns are meaningful and which are spurious. If there’s a confounding variable that you didn’t think of, you could end up with pie in your face when you present your conclusions to someone who did think of it. Since nobody can think of everything, it’s good practice to consider what answers would make sense, given your understanding of the subject at hand, before you look at the data for answers. Let’s see if I can dodge the pitfalls of data-mining as I look for insights into what makes a successful poker player.

Before we shuffle up and deal, I suggest you brush up on how to play No Limit Texas Hold ‘Em. It’s a fantastic game and it will basically train you how to make good decisions by literally making you pay for superstition and irrationality. You learn that good decision-making doesn’t always result in good outcomes in the short-term, but it will eventually pave the way to success. If you play long enough, you will see that players around you whose strategy depends on their emotional state end up sliding their chips your way, sooner or later. Poker initially appears to be a game of chance, but if you take it seriously, you’ll be rewarded with the realization that you’re no longer a slot-machine player, relying on luck for your success; you’ve become the casino. What may have started out as gambling has become an investment opportunity with a positive expected return.

Anyways, let’s get to the data. A little bird provided me with hand history for over 930,000 online poker hands (at tables limited to 6 players) from about a decade ago. The blinds were $25/$50, which is high enough to be considered “serious” poker. It’s not unusual for a player to have over $10,000 at the table and, in the 3 months of data, three players made a profit of over $100,000 (one player lost over $100,000, so over this time period, poker was a more expensive hobby than golf!).

The first (and most time-consuming) step in a data scientist’s workflow is to get the data into a useable format. In this case, the data came as a semi-structured text file such as the following (names anonymized to match their position at the table)…

Game #5811672164: Table Rock Port (6 max) – $25/$50 – No Limit Hold’em –
Seat 1: MiddlePositionPlayer ($575)
Seat 2: CutoffPlayer ($6,244.75)
Seat 3: ButtonPlayer ($7,694)
Seat 4: SmallBlindPlayer ($6,297)
Seat 5: BigBlindPlayer ($9,522)
Seat 6: UnderTheGunPlayer ($6,100)
SmallBlindPlayer posts the small blind of $25
BigBlindPlayer posts the big blind of $50
The button is in seat #3
*** HOLE CARDS ***
UnderTheGunPlayer folds
MiddlePositionPlayer has 15 seconds left to act
MiddlePositionPlayer folds
CutoffPlayer calls $50
ButtonPlayer folds
SmallBlindPlayer raises to $250
BigBlindPlayer folds
CutoffPlayer calls $200
*** FLOP *** [4h 7s 7c]
SmallBlindPlayer bets $400
CutoffPlayer calls $400
*** TURN *** [4h 7s 7c] [3s]
SmallBlindPlayer checks
CutoffPlayer checks
*** RIVER *** [4h 7s 7c 3s] [Ts]
SmallBlindPlayer checks
CutoffPlayer checks
*** SHOW DOWN ***
SmallBlindPlayer shows [6d 8d] a pair of Sevens
CutoffPlayer shows [Jh Jd] two pair, Jacks and Sevens
CutoffPlayer wins the pot ($1,347) with two pair, Jacks and Sevens
*** SUMMARY ***
Total pot $1,350 | Rake $3
Board: [4h 7s 7c 3s Ts]
Seat 1: MiddlePositionPlayer didn’t bet (folded)
Seat 2: CutoffPlayer showed [Jh Jd] and won ($1,347) with two pair, Jacks and Sevens
Seat 3: ButtonPlayer (button) didn’t bet (folded)
Seat 4: SmallBlindPlayer (small blind) showed [6d 8d] and lost with a pair of Sevens
Seat 5: BigBlindPlayer (big blind) folded before the Flop
Seat 6: UnderTheGunPlayer didn’t bet (folded)

Since I wanted data summarized by player, I created a custom computer program with class objects in code that represented players and tracked of all of their stats, such as “looseness” (VPIP, or Voluntarily Put In Pot, which is the percentage of hands a player plays) and “aggression” (the ratio of bets/raises to checks/calls). Each player “object” also had properties tracking their profit, number of hands played, etc. Note that the profit for each player is not simply the total size of the pots they won. For the example above, the CutoffPlayer won a $1347 pot, but $650 was his own money, so the profit for the hand was $697. The need to extract implicit information of interest is why custom code is necessary for the import and that there is no simple “just load it into a database” approach.

After the file was imported, the summary statistics for each player were exported to a text file for easy analysis in Excel. I also tracked stats for 6 additional virtual “players” representing each of the 6 seats at the table: Small Blind, Big Blind, Under the Gun, Middle Position, Cutoff, and Dealer Button. These stats duplicated the actual player stats, but allowed me to look at how the average player acted depending on their position for the hand.

If you’re not familiar with them, these are the positions at a 6-max table…

Figure 2: Table Positions. Betting order is clockwise and the dealer gets the last word.

Another good reason to track stats by position is so that we could do a “reality check” and ensure that the imported data makes sense. For example, players generally play fewer hands when in early position, because the more players that follow you in the betting order, the bigger your disadvantage. We would expect to find that players in unfavorable positions at the table would not only be tighter (more selective about the hands they play) but also more passive (playing more defensively by betting and raising less, in order to limit the size of their losses).

Let’s see what the data says.

PositionLooseness (VPIP)
Button36%
Cutoff22%
Middle Position22%
Under the Gun (UTG)20%
Big Blind (BB)22%
Small Blind (SB)28%
Table 1: Position ranked by Looseness

So, players who were first to act (UTG) only played 20% of their hands. For a sense of what this means in terms of poker hands, if you were to rank the two-card hand types according to how well they match up against random cards, the top 20% would include every hand at least as good as the following: Ace-Three suited (>=A3s), Ace-Seven offsuit (>=A7), King-eight suited (K8s, K9s, KTs, KJs, KQs), King-Ten offsuit (KT, KJ, KQ), Queen-Ten suited (QTs, QJs), Queen-Jack, or pairs of fives or higher (>=55). (Note: “suited” just means that the two hole cards have the same suit.)

As expected, the Looseness increases as the player sits closer and closer to the Button (the Dealer position). Sitting in the best position allowed players to play over a third of the time. It’s trickier to know what to expect in terms of looseness of the blinds, since the Small Blind is in a horrible position, but has already paid some of the price of playing. Similarly, the Big Blind only needs to add money to the pot if somebody raises before the flop. Nevertheless, these stats look reasonable, so I’m feeling pretty good about the imported and organized data.

How about Aggression (ratio of bets/raises to checks/calls)? Again, you would expect players in good positions to be betting and raising more (playing offense), while players in bad positions are checking and calling more (playing defense) to keep the pot size under control. Let’s see if the data matches this expectation.

PositionAggression
Button2.1
Cutoff1.9
Middle Position1.9
Under the Gun (UTG)1.8
Small Blind (SB)0.9
Big Blind (BB)0.4
Table 2: Position ranked by Aggression

Aggression almost perfectly sorts the positions from best to worst! The only exception is that the small blind is the worst seat after the flop (first to act), but these players were more aggressive than the big blind. This can be explained by the fact that the small blind at least chose to enter the hand (at a discount), whereas the big blind sometimes saw the flop with two random cards (if nobody raised before the flop, they can “check” and continue in the hand for free). So again, the data looks reasonable given what we know about poker strategy.

While there aren’t any notable surprises in the data yet, if you believe in the wisdom of the masses, it does confirm that you should play looser (more hands) when you have a good position at the table, playing about a third of all hands dealt when you have the dealer button. It also backs up the idea that players in the blinds should be primarily checking and calling, while players in good position should be betting and raising. The better your position, the more aggressive you can be; with the dealer button you can bet/raise more than twice as often as you check/call.

Now comes the part that really matters: profit. Which positions are the most profitable and which ones cost you chips?

PositionSuccess (profit per hand)
Button$11.09
Cutoff$6.85
Under the Gun (UTG)$6.68
Middle Position$6.19
Small Blind (SB)$(9.48)
Big Blind (BB)$(15.50)
Table 3: Position ranked by Profitability

This clearly shows the importance of position. All things being equal, the player sitting with the dealer button is expected to make almost twice as much money as anyone else! It’s hard to see image how one seat can be so much more profitable than the seat next to it, but there is one thing that’s unique when you have the button: if everyone folds to you pre-flop, it’s just you against the blinds (and they have to act first in every future round of betting). It’s a great spot to raise and win immediately or build a pot where you have the advantage of acting last. Even the cutoff seat right before the dealer runs the risk of the dealer calling or raising their bet and having to play the rest of the hand out of position. In short, the dealer is the only one who’s guaranteed to have a positional advantage.

It’s not a surprise that the blinds are the most expensive seats at the table, since you are literally forced to bet, regardless of your cards. The profitability of the other positions sorts them as expected, except for one: players under the gun (first to act after the blinds) made more money per hand than players in the middle position. Since there’s no good reason why this should be generally true, I wouldn’t read too much into it. The difference is only $0.50 per hand at the $50 big blind table stakes so it may be that there were just a few monster hands that swayed the results.

Note that we don’t just look at total dollars won, since sometimes there are fewer than 6 players at the table and the seats in the worst positions are empty. Technically, the players at the middle position made more profit than the players under the gun ($793k vs. $544k), but since there were 128k hands dealt with a player in the middle position and only 81k hands dealt with a full table (and therefore included a player sitting under the gun), the UTG position made more profit per hand.

It’s good to see that the small blinds and big blinds are losing less than $25 and $50 per hand respectively, or they would have been able to improve their results by simply folding their hands every time they were in the blinds! I was a bit surprised to see that every position other than the blinds was actually profitable on average. Since we know that the poker site is making money from the rake, the total losses must exceed the total wins (in this case $153,500 went from the players to the online cardroom during the months observed). Surprisingly, the losses for the two blinds ($4.75M) more than offset the total winnings from the other four positions at the table ($4.60M).

Let’s move on from stats by position and look at the stats by player. The big question is whether or not playing tight and aggressive (TAG) is generally the winning formula for poker. Excel has a nice Data Analysis add-in that allows you to easily run multiple linear regressions. Basically, you just highlight the profit per hand column as the target variable and select the looseness and aggression columns as your predictive variables and see what it comes up with…

Table 4a: Tight is right. Aggression is not so clear.

While the general conclusions seem reasonable, there’s something a bit strange about the p-value; it’s off the charts! Are there any gotchas we should be looking for? Remember what we’re predicting here: the profit per hand. Well, what if someone just played one hand and won or lost a lot?

Sure enough, there was one player, who sat down with $5,000, ended up going all-in on his first hand and losing, never to play again. His profit per hand is -$5000 and he played 100% of his hands. Similarly, there are 15 others who all played exactly one hand and lost more than $1000, never to return. These outliers need to be removed from consideration, because the extreme looseness and results dwarf any of the values you’d see with regular players and will warp our conclusions. Let’s limit the data to players with at least 10 hands played and see how that changes things…

Table 4b: Tight and Aggressive are the way to go!

Well, the p-value is still pretty outrageous, but we peeked at the raw data and nothing jumped out as an obvious problem, so we’ll run with it. Looking at these results, I’d state with confidence that the tighter players generally make more money. Obviously, you can’t take this to the extreme and say that the best player would play 0% of the hands, but you can say that when comparing any two players in this data set of 1290 players, the tighter player is probably the more profitable one. And the tighter the player, the more profitable you’d expect him or her to be.

What about aggression? Now that we’ve removed the outliers, it appears that more aggressive players are also significantly more profitable on average.

The R-squared value of 0.04 is very low, which tells you that knowing only aggression and looseness can only “explain” 4% of the variation in the profitability between the players. More specifically, if you used the equation suggested by the coefficients above [profit per hand = $7.66 – 0.77 * Looseness + 5.90 * Aggression], your predicted profit would only have a 0.2 correlation with the actual player profitability in the data (R-squared is the correlation squared – a 1.0 correlation would be a perfect prediction, and a 0.0 correlation would mean your prediction may as well have been completely random).

Recall that while we have extremely high confidence that profitability is associated with aggression and negatively associated with looseness, we still have to take this with a grain of salt since we’re just analyzing historical data and not the results of a controlled experiment. There could be a hidden confounding variable that we should be considering. For example, what if we break down the data by how many players are at the table? Conventional wisdom states that as the number of players at the table decreases, you should loosen up the range of hands you play and also play more aggressively. Let’s see what we get if we re-run our regression analysis on 6-player, 5-player, 4-player, 3-player, and heads-up situations.

Number of PlayersLooseness Coefficientp-valueAggression Coefficientp-value
6$(1.28)0.000$1.760.281
5$(0.47)0.007$3.160.110
4$0.020.934$1.340.499
3$0.150.607$0.580.822
2$(0.12)0.680$9.610.004
Table 5: Importance of Looseness and Aggression by Number of Players

There are a couple interesting things here! The first is that the cost of playing loosely is only significant when there are 5 or 6 players at the table. Another finding: playing aggressively isn’t particularly predictive of success (although generally good) unless it’s one-on-one. These results are a bit surprising, but not necessarily out of left field (which is a good thing when you’re worried about data-mining). In summary, you want to be the tightest player at the table when it’s 5 or 6 handed. But if it’s heads-up, you want to be the aggressive player.

Let’s look at how the average players actually played, depending on their number of opponents. And, more interestingly, let’s see how the 10 biggest winners (by total profit) and the 10 biggest losers played…

#Avg Looseness Avg Aggression Top 10 Loose.Top 10 Aggress.Bot 10 Loose.Bot 10 Aggress.
628.7%1.1222.7%1.9729.3%1.20
529.8%1.0224.3%1.9228.3%1.37
434.2%1.0529.8%1.8928.9%1.14
340.8%1.0933.8%1.5937.5%1.49
250.3%0.9747.5%1.5745.9%1.35
Table 6: Looseness and Aggression by Number of Players

As expected, everyone loosens up as the number of opponents decreases. However, notice that the 10 biggest winners are consistently playing 4-7% fewer hands than the average player (with the exception of heads-up situations). Interestingly, both the best and the worst players are more aggressive than average, but the best players do consistently bet and raise more than they check and call. Again, there may be other variables at play, such as that the best players are more likely to seek positional advantage (which in turn leads to more aggressive play). However, describing them as Tight and Aggressive does appear appropriate.

Next time, we’ll discuss more specifically how the most profitable players play. The great thing about poker hand history files is that you can often see cards at showdown and then match them up with the betting patterns from the player earlier in the hand for analysis. With enough data, you’ll have a pretty complete sense of the types of hands people play and how they play them. To me, this is what makes poker so interesting. It needs to be studied in the context of what people actually do, rather than what is best in some theoretical sense. It’s not the optimal strategy you seek; it’s the exploitive one.