True Crime

There have been conflicting reports about the US crime rate in the media.  On one hand, President Obama said last year that “there’s been an incredible drop in violent crime” and “our crime rate today is substantially lower than it was five years ago, 10 years ago, 20 years ago, 30 years ago.”  On the other hand, the then presidential candidate Donald Trump stated that “violent crime has increased in cities across America.  The New York Times described ‘the startling rise in murders,’ in our major cities.”  So which is it?

It is true that the New York Times reported that “data … based on reports from more than 60 cities,  showed notable increases in murders in about two dozen cities in the first three months of the year compared to last year and about a 9 percent increase nationwide.”  However, the long-term trend is undeniable.  The murder rate is practically at an all-time low.

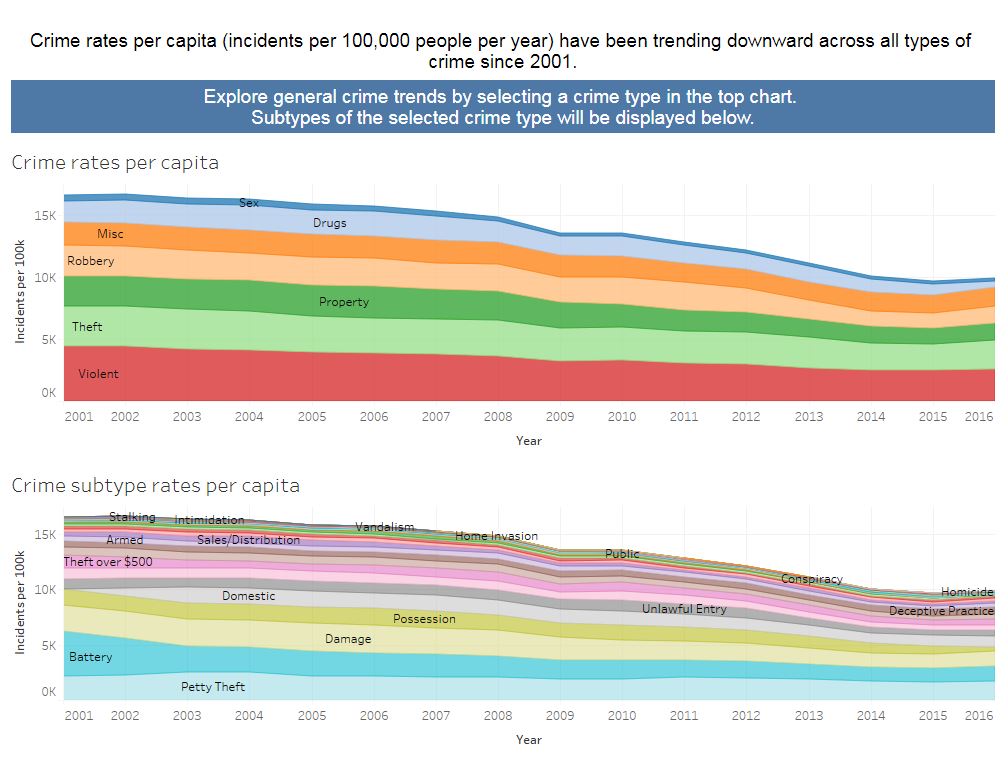
Crime Trends Chart

As the final project for my Data Visualization and Communication class in the Berkeley MIDS program, my team came up with some useful charts, fueled by data from the Chicago Police Department’s CLEAR system, where users can see for themselves what the trend is for a wide variety of crimes.  We categorized the types of crimes according to what we felt would be in the public interest and adjusted for the recent decline in population in Chicago by calculating the crime rate per 100,000 residents per year.  This also provides context so people can understand what the average risk of victimization is per year for any particular crime.

In addition to addressing the misleading statements made by politicians, we also wanted to provide a counterpoint to news broadcasting in this country, which has a financial incentive to focus on the sensational crimes that bring in viewers.  News watchers receive a steady diet of stories about homicide and home invasions without proper context.  Our chart also aims to dispel the perception that those are common types of crime and place them in perspective.  The news is entertaining but not very informative, when it comes to communicating the likelihood of various crimes taking place.

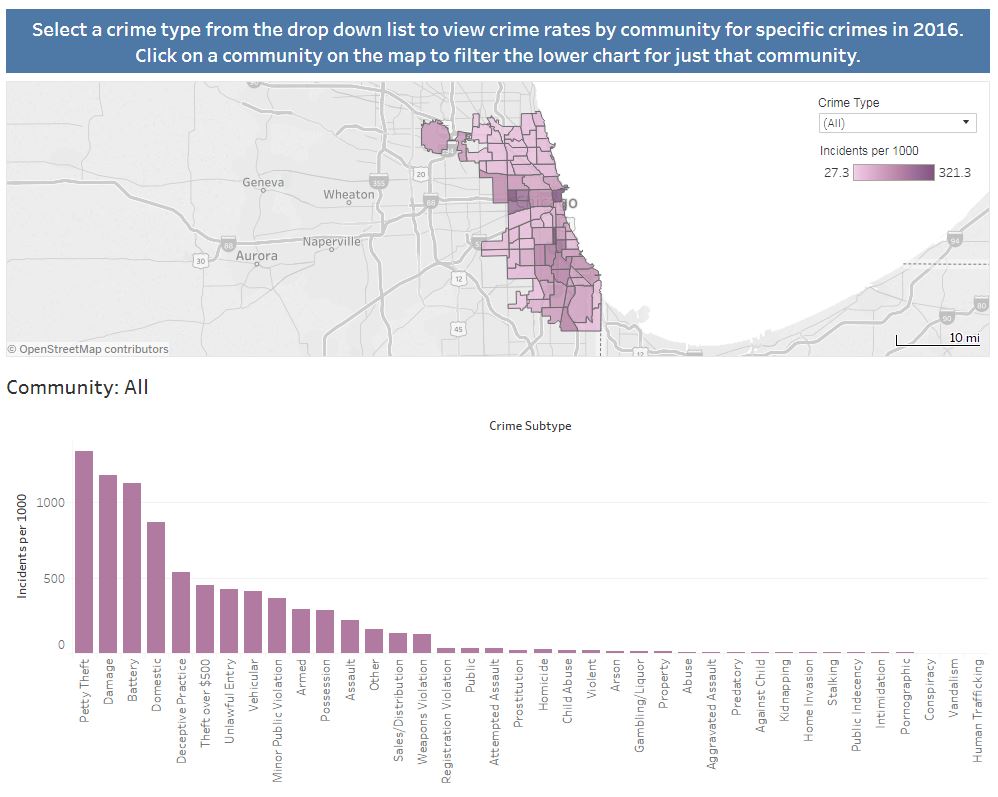
Interactive Crime Maps

While the Crime Trends chart are of interest to the general public seeking information about crime trends, our interactive crime maps are of particular use to someone, such as a home-buyer, interested in crime rates in specific community areas within Chicago.

Users can also select and isolate statistics for communities if they want to quantify the safety of nearby areas or determine the relative safety of traveling through a particular series of communities.  By toggling the selection of areas they wish to compare, they will be able to determine which places are best to avoid.

Enjoy!

–> Interact with our awesome charts here <–

Greatest Hits of RDADA

I just completed Berkeley’s enjoyable DATASCI W201 class “Research Design and Applications for Data Analysis” and figured I might as well share a few of my essays since I crafted them with such tender-loving care.  Enjoy!


Week 5 – Up Is Up by Jay Cordes – Tuesday, 07 June 2016, 09:22 AM

At my last job, there were many examples where decision makers took questionable facts for granted. “Up is up” was even a favorite saying of one of the executives, and I would often have back and forth exchanges with him in meetings when I thought he was being duped by data.

In one case, practically everyone was fooled by a case of regression towards the mean. My business unit designed and conducted experiments to determine which web page designs maximized ad revenue for our customers, who collect domain names. Invariably, some of their domains would perform worse than others, and it was decided that we should try to optimize those “underperformers” by hand (typically, we’d use a generic design across the board). Being scientifically rigorous and only working on a random half was considered overkill.

My friend Brad was the one tasked with actually making the modifications and was given the list of domain names each week that could use help. Every single time he hand-optimized a set of domains, the revenue on those sites would significantly increase the following day (around 30-40% if I recall). He was praised by customers and managers alike who started to wonder why he’s not hand-optimizing all of the domains on our system. Brad was savvy enough to be skeptical of results and smiled knowingly when I pointed out that there’s practically no way for him to fail since the worst domains would be expected to improve anyway just by chance.

Well, one time he forgot to work on the set of domains given to him. The next day, their total revenue skyrocketed by about 40% and the customer wrote “whatever you did worked!” Since the increase was at least as much as we’d seen with his hand-optimizing, it was now realized that he could actually have been harming revenue. If we hadn’t assumed that things could only get better and used a randomized control (selected from the domains he was told to optimize), we would’ve clearly seen whether or not his work was having a benefit. The moral to the story is: up is definitely not always up.


Week 7 – Phones Don’t Cause Cancer, The World is P-Hacking by Jay Cordes – Tuesday, 21 June 2016, 06:46 PM

The article, “Study finds cell phone frequency linked to cancer,” (http://www.mysuncoast.com/health/news/study-finds-cell-phone-frequency-linked-to-cancer/article_26411b44-290a-11e6-bffc-af73cd8bda5f.html) reports that a recent study shows that cell phone radiation increases brain tumors in rats. It also provides safety tips, such as keeping phones away from your ear.

The problem with the article is subtle: the failure to recognize the likelihood of spurious results due to repeated testing. “P-hacking” refers to when researchers hide or ignore their negative results. It’s similar to editing a video of yourself shooting baskets and only showing a streak of 10 consecutive makes. This study wasn’t p-hacked, but the result should still be regarded with skepticism due to the number of other studies that did not find similar evidence. In other words, global p-hacking is occurring when articles focus on this experiment in isolation.

Another way to think of p-hacking is in regards to “regression toward the mean”, which occurs because (1) luck almost always plays some role in results, and (2) it is more likely to be present at the extremes. A small amount of luck will lead to future results that are slightly less extreme. However, if the results are due entirely to luck, they will evaporate completely upon re-testing. With many failed attempts comes a higher likelihood that luck played a big role in the successes.

The article doesn’t recognize that results from other studies should weaken the confidence you should have in this one. It also mentions that the radiation is non-ionizing, but doesn’t note that only ionizing radiation (high frequency electromagnetic radiation including ultraviolet, x-ray, and gamma rays) has been shown to cause mutations. From a purely physical standpoint, cancer-causing cell phone radiation is very unlikely. Also, no mention is made of the fact that cancer rates haven’t skyrocketed in response to the widespread cell phone usage around the world.

The only criticism I have for the experiment itself is the fact that the results were broken down by male/female. What explanation could there be for why females were not affected by radiation? Would the result have been significant if the sexes were combined? A couple “misses” do seem to have been edited out.

I chose this blind spot to discuss because I believe it scores a perfect 10 in terms of its pervasiveness and negative impact on interpreting results. At my last job, we ran a randomized controlled test on web pages of a few different colors and found no significant difference in revenue. My boss then recommended that we look at the results by country, which made me wince and explain why that’s a data foul. An analyst did look at the results and found that England significantly preferred teal during the experiment. Due to my objections, we thankfully did not roll out the teal web page in England, but kept the experiment running. Over the next few weeks, England appeared to significantly hate teal. It pays to be skeptical of results drawn from one of many experiments.


Week 10 – Jay Cordes: Visualizations Can Affect Your Intelligence by Jay Cordes – Monday, 11 July 2016, 11:33 PM

The worst visualization I’ve ever seen actually makes you dumber for having seen it. It’s this one from Fox News evidently attempting to show that global warming is not a thing…

every-day-is-april-fools-at-fox-news-L-byleIS

Figure 1 – Wow, this is nonsense.

It’s not bad in the sense of Edward Tufte’s ”chartjunk” (there’s no graphical decoration at all). It’s also not violating the idea of data-ink maximization (there’s actually not enough ink used, since there’s no legend explaining what the colors represent). It’s bad because:

  1. It’s flat out nonsense. It turns out that the map on the left shows whether temperatures were higher or lower than normal the prior March, while the map it’s being compared to is the absolute minimum temperature on a particular day.
  2. Even if the chart were actually comparing what it pretends to be, it would still be meaningless. Can a one month exception cast doubt on a decades long trend?
  3. If the colors on the map on the left map actually meant what they appear to mean, then we are supposed to believe that Minnesota hit 100 degrees in March of 2012? When it did set the record for the hottest average March temperature in history, but it was only 48.3 degrees.

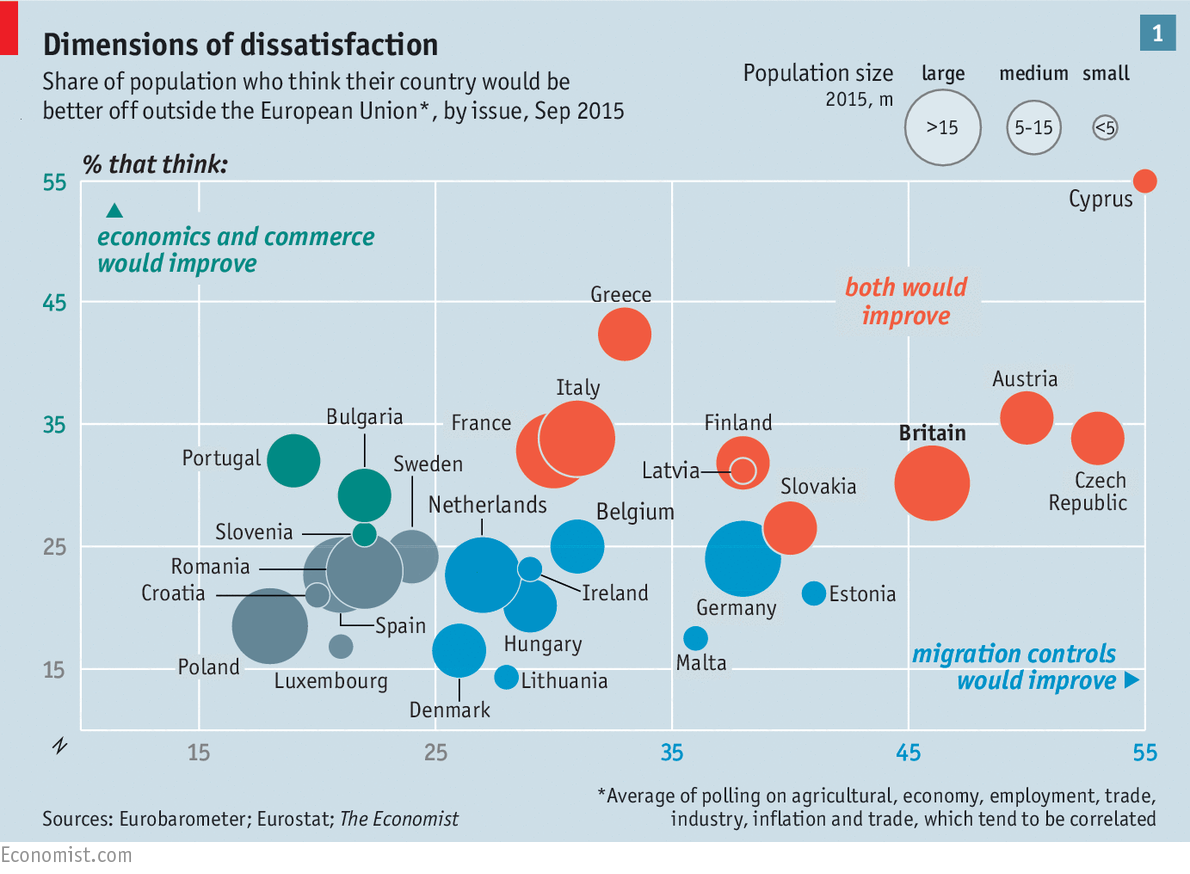
On the other hand, one of the best charts I’ve seen is this one from the Economist that we used in our presentation on Brexit.

20160702_FBC814

Figure 2 – Now we’re learning something

There’s a density of information that is presented very simply and efficiently: Which European countries believe they’d be better off outside the European Union? Is it more that they think their economics and commerce would improve or their migration controls? What are their population sizes? Why did England vote to leave? Unlike the Fox News chart, the data is presented truthfully and clearly. Answers to all of these questions can be quickly drawn from it. I also like the subtle details, such as making it clear what the colors of the circles represent by simply coloring the font of the axis labels. The grid lines are white on a light gray background to avoid cluttering up the chart. Also, the population sizes are rounded to one of three values to simplify comparison. This chart definitely follows the idea of data ink maximization.

Sources: http://mediamatters.org/blog/2013/03/25/another-misleading-fox-news-graphic-temperature/193247 http://www.economist.com/news/briefing/21701545-britains-decision-leave-european-union-will-cause-soul-searching-across-continentand http://files.dnr.state.mn.us/natural_resources/climate/twin_cities/ccmarch1981_2010.html http://shoebat.com/wp-content/uploads/2016/06/20160702_FBC814.png http://m5.paperblog.com/i/48/483755/every-day-is-april-fools-at-fox-news-L-byleIS.jpeg

Relax, the Crime Rate Isn’t Spiking

These days, if you listen to presidential candidates of various hand-sizes or watch a lot of news, you probably think that a crime wave is overtaking the United States.  However, if you happen to be a data science student who’s looking at crime data and working on homework assignments like these, you probably know better.

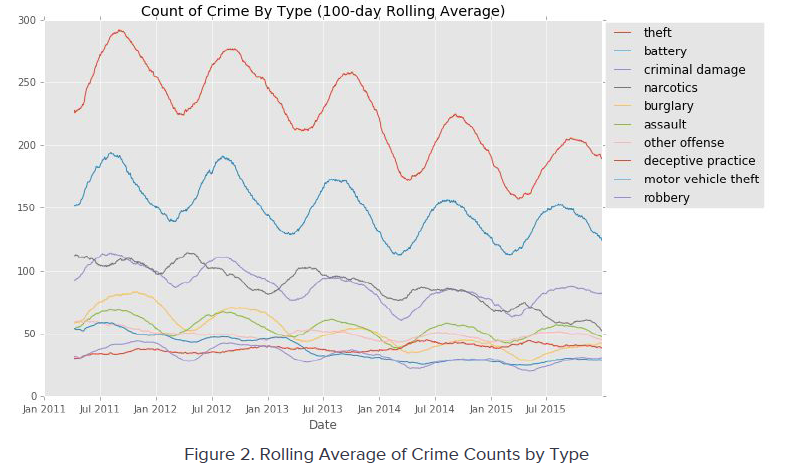
Here’s some recent data about crime in Chicago…

CrimeByDay

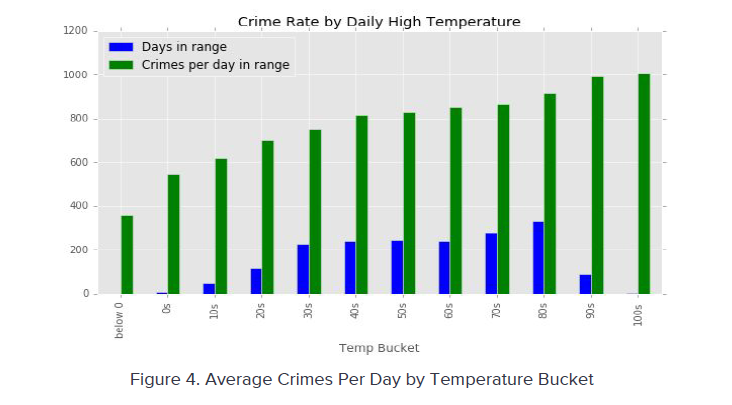
Pretty much every type of crime is dropping year after year and it’s been happening for quite awhile. If you insist on worrying about stuff, you should know that theft, battery, and criminal damage are the most common types of crime and make up about half of all arrests.  Also, in case you’re curious, those cycles in the figure above are due to the fact that more crime occurs when it’s hot.

CrimeByTemp

It’s incredibly consistent: as the temperature goes up, so does the crime rate.  So, if you’re really worried about crime, stay in your safe room during hot days.  Actually, it turns out that safe rooms aren’t that necessary either.  Home invasions, while they make good news stories, actually made up 0.085% of all crime in Chicago.  That’s not 8.5%, that’s 8.5 one hundredths of a percent.  Similarly, homicide, while making up about a quarter of the crime stories on the news actually represent less than 0.2% of all crime.  There should probably be some kind of a warning label on newscasts: “We’ve chosen to show you tons of murders only because it’s exciting and brings in viewers.  We are in no way implying that the Zombie Apocalypse is upon us.”

So, rest easy kids!  Put down the guns, because you’ll probably just hurt yourselves.  And whatever you do, don’t travel into the past, because that’s where the real danger lies.

Survivors of the Software Project From Hell

During my 11 years as a software developer, there were many adventures, but none can compare to the brutal and at times hilarious experience of working for a home developer on their software system around the turn of the millennium.  My software company was hired to help salvage a disastrous and over-budget program created by another company (whose name, my friend discovered, is anagram for “Crummy Gnome Typists”).  I don’t even know where to start, so let me just describe some of the characters who worked there and how they responded to an insane working environment.  These people actually exist.

The Manager

The manager was a dedicated worker.  Dedicated, like “take a business call outside the church while your kid is being baptized” dedicated.  I heard that happened.  He also expected others to be similarly willing to sell their souls.  One time he was actually somewhat reasonable: I had requested Friday off to take a Microsoft exam and I approached him at midnight on Thursday night and said “you know, technically, I requested TODAY off to take that exam at 9 am.  May I go home?” and he didn’t fight me too much.

Other times, not so reasonable.  There was the time we all worked on Sunday without air conditioning and a programmer’s wife (her name was spelled crazy because her parents “couldn’t spell”) brought her triplets and sat them on a blanket on the floor all day while we were programming.  I think she thought her husband was having an affair because she couldn’t believe the number of hours he was working.  Well, she got to see with her own eyes what his life was like, because when 9 pm rolled around, she approached The Manager and told him the triplets needed to go to sleep.  He said “Sure, take them home.  But your husbands’s not going anywhere, because he’s got work to do.”

The Comedian

The Comedian was like a Colombian Will Smith.  Charismatic, self-deprecating, and full of hilarious (and hopefully exaggerated) stories of childhood abuse from his mom (he says he cut his hair short so she couldn’t shake him by it), he always had us rolling, even when we were hanging onto dear life by a thread.  The pressure to work practically 24 hours a day and without breaks was so intense, he and I would keep an eye out for The Manager and, if we lost sight of him, would literally RUN out of the building so we could go out for lunch.  When work hours exceed 80 hours in a week, you learn to treasure the comedy, because it’s basically the only thing to keep you going.

The Business Analyst

The Business Analyst was frazzled.  We would count the hours each day before she dropped her first f-bomb and it rarely grew larger than one (however, Starbucks seemed to lengthen the times).  One time, I was the recipient of one of her streams of profanity after she’d heard enough of my reasons about why a deadline was unreasonable:

The Business Analyst: “Just tell me it will be done by then.”

Me: “Fine.  It will be done by then.”

The Business Analyst: “Thank you.”

Me: “You know, just because I say it will be done by then doesn’t mean it will ACTUALLY be done by then.”

The Business Analyst: “*@#$&* @#$&**@ $# you &**@#*!!”


One time, she worked all night long.  The best programmer from the “gnome typists” cracked and started crying in the middle of the night, admitting that he just couldn’t do it anymore.  After he left, her team somehow patched together a demo in time for the scheduled meeting in the morning, but she just about lost it when the CIO criticized her for not wearing the company t-shirt on “wear the shirt” day.  For some reason, she felt like she had a good excuse, since she was still wearing the same clothes from Thursday.

When she wasn’t at her breaking point, we would do our best to keep her spirits up with lots of friendly teasing.  We’d tease her about her fear of trains (she’d practically jump out of the car if you were stopped at the tracks when a train came by), we’d tease her about the fact that her boyfriend looked exactly like The Manager, we’d tease her for adopting a strange mouth expression from a co-worker (evidently weird faces are infectious), and we’d tease her about her two pictures of what looked like the same cat.  She insisted that she had two cats, even making a point when we were by her apartment to run in and bring out a cat and shout “one cat!” and then run back in and bring out another cat and shout “two cats!”  Later, I asked her how I could be sure she wasn’t just showing me the same cat twice.

Junior (“Boy”)

Junior was a soft-spoken and reasonable programmer.  Thanks to him, we once saw a softer side of The Manager that we didn’t know existed…

The Manager:  “I’m not really comfortable calling you ‘Junior.’  What’s your actual name?”

Junior:  (three syllable name that’s hard to pronounce)

The Manager:  “… um, didn’t you have a nickname in the Philippines?”

Junior:  “Yeah!”

The Manager:  “Great!  What was it?”

Junior: “Boy.”

The Manager:  “Never mind.  I’ll call you Junior.”


Junior was one of those guys who always seemed to have misfortune strike him for no reason.  He told us that one time at his prior job, he got a haircut at lunch and the hair-cutter thought he wanted a buzz-cut and had already started to shave a stripe down the middle of his head before he grabbed her arm in protest.  It was too late to fix it, so she shaved off the rest of his hair, which alarmed his co-workers when he returned to work.  Another time, he woke up at home in the middle of the night with a bang and a bleeding lip.  His baby son had head-butted him in the mouth while he was asleep and since he woke up with a yelp, the startled kid began to cry.  Evidently his wife actually got mad at him for scaring the child.

The Smiley Guy

This was The Smiley Guys’s first on-the-job experience with programming, so he thought that maybe all projects were like this.  He did suspect that it wasn’t healthy when he calculated that due to our annual salary and the ridiculous hours (he worked 98.5 hours one week), we were earning less than workers at Burger King.  He seemed strangely impervious to the pressure.  He just sat there happily programming, even when The Business Analyst was literally shaking his chair and saying “Is it done?  Is it done?  Is it done?”  When someone cruelly glued his favorite candy, a Peep, to the top drawer of his desk during Lent, when he wouldn’t indulge in such treats, he didn’t even take it down.

In some ways, he was the anti-Business Analyst.  His leisurely pace sometimes drove her kind of crazy when we went to lunch.  He would twirl each spaghetti strand around his fork one at a time and she would watch him like she was ready to pop.  Also, he NEVER cursed.  In fact, he made up words he could use instead of curse words, like “Tokugawa!” “Toodily Do!” or “Zut Alors!”  He also probably had no fear of trains whatsoever.

The Bot

The Bot took things literally.  Literally.  I actually got a kick out of talking to him, because I’m a programmer and it was like a game to try to phrase things as unambiguously as possible.  Other people weren’t as amused.  The Business Analyst once asked him if he could do something and he said yes.  A week later, she asked him when it would be finished and he responded “you asked me if I COULD do it, not if I WOULD do it.”  He had a habit of starting every other sentence with “point being” until the day he paused in thought and I said “point being…”  With a surprised head tilt, he said “yes!” and for a moment seemed puzzled that I had spoken the exact words he was about to utter.  He must’ve figured it out because he never spoke the phrase again.

Boots

While The Bot constantly started sentences with “point being”, Boots stole the show with his opening: “the thing is, though, is that…”  Visualize the red-haired bully in A Christmas Story as a programmer who wears infantry military boots every day and a scowl.  He always wanted to share his cartoons with us where the main character was basically him being pissed off about everything.  He was a knowledgeable programmer, but seemed drawn to unreasonable complexity and we paid the price for that several times.  For example, the application took 30 minutes to compile each time, because it was a collection of about a dozen dlls that were all tied to each other in some weird way that required them to each be compiled in a precise order (known as “dll hell”). He also got great pride from the fact that he used Windows API calls to create an application where the outside of the screen was actually a different program than the inside.  Of course, this led to bizarre bugs like when two buttons somehow had the focus highlight at the same time.  One time, he seemed to think he was vindicated when he was asked to change the icon at the top of the program.  He changed it once, in the “outer” program and explained that if he had done things in a more traditional way, he would’ve had to spend 10 minutes going through and changing it in all of the sub-screens.  “THAT’S why the program is made this way!”

He was a pretty disgruntled guy, with his triplets adding sleep-deprivation to his list of complaints, so when he was fired and threw his keys at the manager, we were all a little on edge that he’d be back with more than just military boots.  Thankfully, the only thing we heard from him after that was a creepy phone call months later to The Business Analyst, opening with “do you miss my voice?”  She said that it literally made her shiver.

Bloody Knuckles

One guy who didn’t seem angry at all had bloody knuckles one day.  We were like “what happened?”  “Oh, I just got frustrated and punched the wall.”

The kickboxer

Even scarier was the Muay Thai kickboxer with a scar on his eyebrow.  He famously told us that his strategy for dealing with The Manager’s questions was to “blast him with bullshit.  Just BLAST him.”

Some lady (“wiggle worm”)

There was some lady who would disturbingly sneak up behind me and try to rub my back while I was working.  I quickly learned to always swivel my chair around and face her anytime she came close to my desk.  The day they had to let her go was the funniest firing conversation I’ve ever heard about.

The Business Analyst: “I’m sorry we have to let you go.”

Lady: “But you said you had wiggle worm in the budget!”

The Business Analyst: “What?  Wiggle worm?”

Lady: “Yes, you told me there was wiggle worm in the budget and that I didn’t have to worry.”

The Business Analyst: “Wiggle worm?”

Lady:  “What?”

The Business Analyst:  “Did you say wiggle worm?”

Lady: “I SAID WIGGLE ROOM!!!”


Me

I suffered along with everyone else, but jumped at the chance to build a loan pre-qualification screen, since I was planning on buying a home soon and wanted to learn everything I could about the various loan options out there.  I binged on Home Loans for Dummies and anything else I could read on the subject.  Evidently not realizing that the confluence of my work and personal interests was what had put me into turbo learning mode, The Business Analyst got the impression that I was some kind of a superstar (she told someone “if all programmers were like Jay, I wouldn’t have a job”).  She and I were trying to meet with a loan officer in the building to get some important questions answered, but for some reason the meetings kept getting put off and our deadline was approaching fast.  We finally met with the guy and it couldn’t have been two minutes after we sat down in the kitchen with him when the power in the building went out and we were plunged into total darkness.  We sat there for another minute or so, hoping the power would come back on before finally giving up: “I guess we need to reschedule again.”

Back to school! “Please don’t force push”

While I couldn’t have been more excited to start the MIDS program (Master of Information and Data Science) at UC Berkeley, the very first class just happened to conflict with the opportunity to meet this Guy…

BillNyeTheScienceGuy

I guess that proves that even more than a “data wonk,” I am at heart a “science freak.”  We ended up even getting to walk with Mr. Guy on the way to go see his buddy Neil deGrasse Tyson give an entertaining lecture about Sci-Fi movies and their scientific accuracy and/or lack of it, so it was a full-on geek-out that night.  But I digress!

Prior to the first live classes, we had access to a killer application that provided access to tons of pre-recorded lectures.  I have it on my desktop, my iPhone, and my iPad…

ISVCApp

You can stream the lectures or download them for offline viewing later and can adjust the speed of the video to really plow through them in record time.  If you go fast enough, you feel like you’re Neo downloading knowledge directly into your brain.  Before long, your screen has check marks by everything and then you look up and say to yourself “I know Python.”  You know you’re addicted to the app when you grab your iPad and are actually not sure whether you’d rather check to see what your classmates and professor are posting on the wall or play Plants vs. Zombies.  Admit it, just by reading this and you’re already starting thinking about studying for those GREs and going back to school!

Finally, it was time for live classes to begin…

FirstMIDSClass

Not your gramma’s graduate school!  It was a lively and interesting discussion and nobody sang the Brady Bunch theme song.  There also wasn’t any singing when the 2nd homework assignment was handed out and was surprisingly challenging: writing python files from within a bash script and getting up to speed on a code versioning app called git.  Being pretty new to git, I forgot to add a comment once at the end of a “git commit” command and was thrown into a nightmare of a text editor called vim that I COULD NOT ESCAPE FROM without doing web research.  Turns out that the command I was looking for was “:wq” to close the window.  As a former software developer, stuff like that drives me crazy.  Even if a programmer was sick enough to think that that was a good command for something as common as closing a window, did he/she not have a manager to say “Okay, you know that someone other than you might end up using this program, right?”

A friend of mine backed up my initial impressions of git’s user-friendliness: “Yes, git is overwhelmingly cryptic.  A basic workflow can be described in a more straightforward way, but God forbid anything go wrong.  I’ve spent many half-days trying to fix a mistake in git.  It’s kind of amazing to me that it has caught on as much as it has.”  He also supplied me with this helpful advice…

git

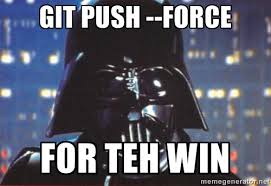
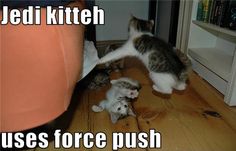
I ended up getting through the assignment without too much trouble, but evidently others went a bit astray, because the following day, the professor posted a message on the wall: “…Please don’t force push to the github playground … if you do that, that means you’re going to overwrite someone else’s changes.  If you do that, we can’t keep track of who all made changes.  That means we’ll also be modifying the assignment – we just want you to have one change in the github playground.”

After reading that, I naturally had to post the following to the wall…

ForcePush2

ForcePush

Good times!

How To Spend Your Time

With the recent passing of Oliver Sacks, I was reminded of the moving essay he wrote after learning he only had a few months to live.  I’m very grateful that he spent one of his last precious days on this planet sharing his reflections and thoughts about what he finds worthwhile.  I’m always interested in how thoughtful people spend their time, since I tend to think of us all as being short on time and never truly aware of its value until it’s almost gone.

So, let’s discuss it now.  In this age of cell-phones, we’ve become adept at never “wasting” time, but not as good at “spending” time.  As a believer in the wisdom of the masses, I think one of the best ways to find out what I should be doing with my free time is to compile the ideas from essays, such as the gem Dr. Sacks and others have left us with.  After all, “ask the audience” beats “phone a friend” hands down.

Supposing that all of the top responses are worth doing and that I should spend my free time in proportion to the number of votes received, here are the ideas…


How To Spend Your Time Votes  %
Connect with Loved Ones.  Deepen friendships / make a difference in lives around you. 14 22%
Have Fun.  “Squeeze as much happiness” as you can.  Laugh.  Be entertained by cats. 7 11%
Be In The Moment.  Take dog for a walk, enjoy a sunset, travel, eat favorite food. 7 11%
Learn and Discover.  Develop abilities or character / new levels of understanding and insight 6 9%
Do Something Useful.  Your profession / achieve things that contribute to society 5 8%
Do Something Creative.  Art / writing. 5 8%
Be Kind.  Be gentle to each other. 4 6%
Relieve Suffering.  Help people / share knowledge. 4 6%
Read.  Connect with people who came before us. 3 5%
Enjoy Music. 3 5%
Enjoy a Hobby.  Gardening. 3 5%
Give your kids Opportunity, Skills, and Empathy to enjoy their lives.  Show them wonder. 3 5%


Sounds like a great day to me!  Well, except for the gardening (someday, I expect that a “gardening gene” will activate and I’ll suddenly have an irresistible urge to pull weeds until my back hurts).  The clear winner was connecting with loved ones.  I’ve always been one to repeat the mantra “when you’re on your deathbed, you’re not going to wish you spent more time at work.”  One of my proudest moments was when, instead of asking for a raise, I took the bold step of asking my manager to cut my workweek and pay by 20% so I could spend more time with my family.  Her initial response was an incredulous “you can’t do that, you’re a manager!” but later had a change of heart and said she admired the move.  I definitely noticed the increase in my time and quality of life much more than I missed the extra pay.  If you can afford to do this, why wait for a health scare to send you home to the people who matter most in your life?

In second place, there was a tie between “having fun” and “being in the moment”, if those are even different things.  Since reading these essays, I’ve been more on the lookout for opportunities to find memorable moments in life to savor and it’s already paying off.  My most recent precious moment was when my family and I were staying at a hotel on the beach and my 12-year-old daughter wanted to go out to see the ocean at 10 pm!  I wasn’t even sure if we were allowed to go out there, but armed with the wisdom of the masses telling me that unique experiences like that are important, we went out into the darkness.  Nobody else was around and it was so dark and clear that, as invisible waves crashed on the shore, we could actually see the Milky Way stretching across the sky for the first time.  She later said that she’ll remember that experience forever.

In our daily rush to check off our to-do lists, moments like those are the ones that most of us let slip by because we “don’t have time”, while the few who truly know the value of time understand that what we actually don’t have time for are missed opportunities.


In defense of the “hot hand.”

You may have heard that, contrary to conventional wisdom, most research discredits the idea that NBA players can get “hot”(see here  and here).  Researchers say that sequences of made baskets occur just as often as you’d expect if they each shot was completely independent.  I have always been skeptical of this conclusion, but other than nit-picking the way the studies analyzed the data (for example, not accounting for varying levels of defense or time elapsed between shots), I couldn’t think of a way to statistically demonstrate it.  I felt that best way to measure hot streaks would probably be to analyze the 3-point-shooting contest, which takes most of the other variables out of the equation, but how could there possibly be a large enough sample size to demonstrate that a player’s shooting percentage is a less accurate predictor of a shot’s success rate than the result of the prior few shots?

Then, I read Economist Gary Smith‘s upcoming book, Lucky – The Surprising Role of Luck in Our Everyday Lives (keep an eye open for it this year – it’s great), and saw an argument that considered the length of the longest streaks of made baskets in relation to the total shots taken.  In my mind, this was the missing tool I’d been waiting for.  We have a record of all NBA participants in the 3 point contest (on sites like this) and we have a list of the longest streaks of made shots (see this one on Wikipedia).  So we’re set!

Before we get to the data crunching, here’s a little background: once a year, the best 3-point shooters in the NBA are invited to compete against each other for the title of 3-point contest champion.  The way the contest works is that the players take turns trying to make as many shots as they can out of 25 (from 5 different spots behind the 3-point line) in one minute.  There have been slight variations in the rules over the years regarding “money balls” that are worth 2 points each, but for the purpose of this analysis, we’ll consider only the makes vs. the misses.

The first thing we need to know is the general shooting percentage for the competitors.  Historical data shows that the competitors average about 51% of the best possible score, so that’s what I’m considering the baseline percentage.  Since there’s not a huge discrepancy between the shooting percentages of the top players, I simplified the problem by treating them all as if they are the same player, with a shooting percentage that’s indistinguishable from a coin-flip.

Here’s how we can determine whether or not hot streaks exist: suppose they don’t exist.  This means that the series of makes and misses from these contests should be indistinguishable from a series of people flipping coins against each other.  That’s because coin flips are known to be independent events and have streaks that are only due to luck, and not a “hot hand.”  If it turns out that I can tell you how to look at a string of 1s and 0s and determine whether it represents baskets or coin flips, then the baskets must not be independent events.

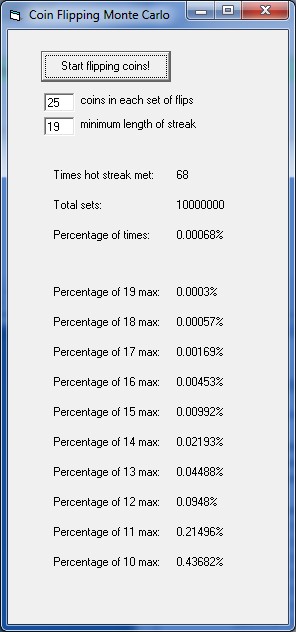
Well, there have been almost 350 competitors over the years, so the first question I had was: if 350 people were flipping sets of 25 coins, how often would we see a streak of heads like this.  Yes, that happened; Craig Hodges drained 19 in a row in 1991.  The math gets a little hairy with the principal of inclusion / exclusion considerations, so I was more comfortable writing a small computer program to simulate 10,000,000 sets of coin flips (Monte Carlo method) and keep track of the longest streaks.  Here’s what I got…

montecarlo

Streaks of at least 19 heads occurred 68 times out of 10 million.  So that means that my friend Mr. Carlo would put the probability that we’d only see a Craig Hodges of coin-flippers 0.00068% of the time, even if we had 350 cracks at it.  This was pretty strong evidence for the existence of a hot streak (at least for one man), but I wasn’t totally comfortable with the conclusion yet.  The second longest streak was only 13 makes in a row (Stephen Curry this year), and based on the simulation, a streak of that length wouldn’t be an outlandish result after all these years, happening almost a third of the time.

Here were the average number of occurrences of each streak length per 350 sets (25 flips for each set)…

19 heads – 0.00

18 heads – 0.00

17 heads – 0.01

16 heads – 0.02

15 heads – 0.03

14 heads – 0.08

13 heads – 0.16

12 heads – 0.33

11 heads – 0.75

10 heads – 1.53

It didn’t sit well with me that the evidence for hot streaks seemingly rested on one supernatural accomplishment, so I looked for another way to spot the “hot hand” in the data.  Instead of just looking at the longest streak, what if we considered the total number of very long streaks?  Based on the data above, we’d expect 2.91 players on average to have streaks of at least 10 by now.  Well, it turns out that we have seven

Most consecutive shots made
Player Shots Season
Craig Hodges 19 shots 1991
Stephen Curry 13 shots 2015
Larry Bird 11 shots 1986
Hubert Davis 11 shots 1996
Kyrie Irving 10 shots 2013
Jason Kapono 10 shots 2008
Ray Allen 10 shots 2011

This seems pretty strong; we’ve seen more than twice as many streaks of 10 or more than we’d expect from flipping coins.  But how unlikely is it?

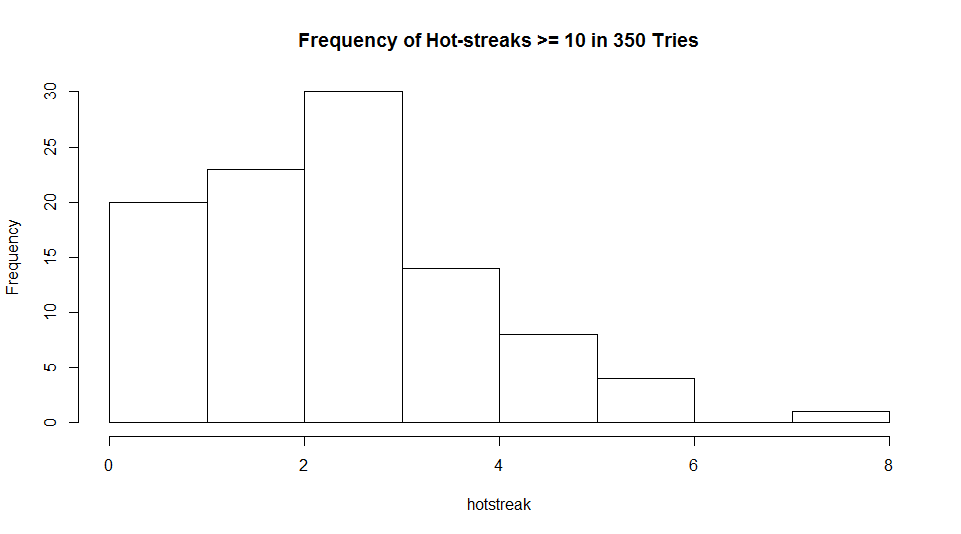
I had my friend Mr. Carlo run 100 alternate histories of 350 sets in which NBA players flipped coins instead of shooting baskets and here’s what I got…

Hotstreaks


Well, I think this is enough to call it.  If hot streaks are imaginary, seeing 7 players out of 350 hit at least 10 in a row would only occur about once in 100 times.  So, the next time you hear someone complaining about how stupid people are to think that streaks exist, like this guy, ask him the last time he saw someone flip 19 heads in a row.  Or 77 in a row.


The Gamblers and the Actuary

I would not describe myself as a “gambler.”  Although I enjoy thinking about casino games, I almost never play them.  One exception was the time my wife and I went with friends to a casino in Barona.  While we were there, we saw a promotion: if we join their card club and play slots for 2 hours, they would refund our losses or double our wins, up to $200.  After confirming that we could ensure ourselves no worse than a break-even gambling session, my friend and I hit the video poker machines.  We played for $1 a hand until there were 15 minutes left.  I still had $150 of my $200 left, so I bumped up the bets to $5 each.  Then, I hit a royal flush.  I waited at the machine until someone came and counted out $4000 in cash.  After he handed over the stack of money and left, I realized that any losses occurring now were actual losses, so I stopped playing and waited out the remainder of the time before collecting my additional $200 matching prize and leaving the casino.  I haven’t played video poker there or anywhere else since then.  Casinos must hate guys like me.

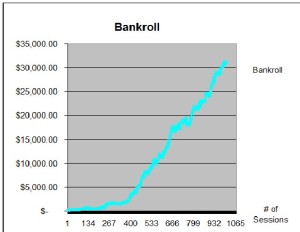
When I started playing online poker (against people, not casinos), I only invested $50 and slowly built my bankroll up to $100.  At that point, I was so paranoid that other players would cheat me or beat me out of all of my money, I took out my initial $50 back out.  From then on, I was on “house money” and never looked back.

Picture6

After my father-in-law found out that I was playing online poker and saw my chart above, he took my wife aside and advised her to secretly stash away some money so she could take care of our daughter when I inevitably blew through all of our savings.  She just busted up, because he obviously didn’t know me very well.

The first guy that I met with an actual gambling problem was someone I worked with when I was a software developer consulting for HdL Software.  He would not only sneak out of his house at night to go to the casino (leaving his young kid alone), his game of choice was the one with arguably the worst odds in the house: Keno.  It wasn’t enough that he played with a horrible return on investment; he would have the computer to continually auto-pick his numbers for him without even requiring him to push a button.  And as if that weren’t enough, he’d have two machines running at a time and burning through his money while he would stand there enjoying a drink.

Of course, occasionally he’d show up at work with a wad of cash talking about his big win.  However, even he had no illusions about the direction of his cash flow.  He estimated that his hourly loss was around $100 for each hour he spent in the casino.  He wanted to quit, but just couldn’t.  I was curious why, if he was going to gamble, he wouldn’t at least play games with much better odds, like blackjack.  Eventually, I figured out that it was because blackjack doesn’t have the potential for a “big win”.  You typically can only win twice the amount that you bet.  So I came up with an idea for him.

I asked him what he considered a “big win” and he said $20,000.  I looked it up, and for you to win $20k with a $1 bet, you need to pick and hit 8 numbers.  The chances of this occurring are 0.00043%.  So here’s what I told him to do: learn and play basic strategy at blackjack, but when he wins a hand, let it ride and bet his winnings on the next hand.  For example, if he were at a $1 table, if he doubled up 15 times in a row, it would be worth $32,768!  His response was that the chances of winning 15 hands in a row was too incredibly low.  I showed him how, at about 49.5% chance of winning, the odds of 15 wins in a row is 0.00262%, or about 6 times as good as the Keno big win, and it paid over 50% more!  When the logic sank in, rather than switch to blackjack, he actually stopped gambling for the first time since I’d known him.  Until that moment, he had never truly realized how badly the odds were stacked against him.  Of course, he started gambling again a few months later, but I had almost cured him.

The second guy with a gambling problem I met was someone who got so tired of losing his money at online poker, he had told the bank to stop allowing him to send money to online casinos.  When he found out I had developed a simple all-in or fold poker strategy that was exploiting the fact that some poker sites allowed you to buy-in as a short-stack, he desperately wanted me to teach it to him.  I was pretty sure that “the System” would probably work for him, as it had for others who knew much less about poker, but had a feeling it wouldn’t end well.  However, the question nagged at me: if someone with a gambling addiction actually had a strategy that made money, would he still have a gambling problem?  Or would he just be a profitable work-a-holic?

I eventually shared the System with him and at first, he was a poker monster.  He made $12,000 in the first month.  Once, when he took my wife and me out to dinner to celebrate his success, I asked him to show me his bankroll chart and it didn’t quite look like mine.  His had occasional huge losses in it.  I asked what that was about and he said that other players would heckle him through the chat box and challenge him to heads-up matches, which he would eventually accept and get crushed.  He turned to my wife and said “I’m sick Cathy.” (she’s a psychotherapist)  “It’s horrible when you know it about yourself.”  I told him to turn off the chat window!

He seemed to be under control and profitable until he told me about his plans to play at the $50 big blind level.  Even buying in as a short-stack meant he’d be betting $500 on each hand.  I had never played at or evaluated the system above the $20 big blind level, so I didn’t recommend it.  The System was exploitive, not optimal.  That means that it could be beaten by knowledgeable players, and generally, the higher the stakes, the more knowledgeable the player.  Even though my friend was making a lot of money, he had gotten bored.  His first trip to the $50 big blind level didn’t go well; he lost $4500 in one evening.  He didn’t keep me up-to-date on his results anymore, but when I ran into him much later, he admitted that he had given the entire $12,000 back to the poker economy.  The experiment had run its course and his gambling addiction had emptied his wallet again, even when the game should have had a positive expected return.

Other friends had their own stories with the System.  One friend said he was willing to invest $1000 and was full of confidence.  I told him to start out at the $2 big blind level, betting $20 per hand, and trained him for about an hour at my house.  He had learned the strategy well and was ready to go home and try it on his own.  An hour later, he called us up…

“I’m taking you guys to steak dinner, I’m up $1000!”

“That’s not possible at the limits you’re playing at.”

“I’m looking at my balance right now and it says up a grand.”

“Go back to the table you were playing at.”

“Hmm, it’s not letting me buy back in for less than $940.”

“The maximum buy-in for those tables is $200!”

Then, I realized what had happened.  He had accidentally played at 10x the stakes he intended to.  He had been betting $200 per hand instead of $20 and just happened to get lucky.  His ADD sometimes caused him to let little details like that slip by.  However, on the bright side, it also gave him the super-power to play 10-12 tables at a time, which would have given me a stroke due to the stress of trying to keep up.  He eventually made well over $10k and unlike the gambler, he kept his winnings.

My favorite success story came from a friend who couldn’t be more different from the problem gamblers.  He promised to stick to the System and told me “as an upstanding actuary, I have absolutely no creativity.”  He told me he didn’t play poker and didn’t like gambling and I told him “you’re perfect.”  His statistical mind and distaste for gambling gave him endless patience to play at low stakes.  He never went down more than $2.50 and was continually playing at micro-stakes to ensure it stayed that way.  I started to harass him into playing higher stakes and eventually his wife joined in, saying “I don’t want my husband playing a video game all day for $4 an hour.”  He finally relented to the pressure and bumped up the bet-sizes.  It paid off as he soon pocketed a few thousand dollars.  At one point he wrote me this email:

“I had a rough night tonight and then a roller coaster ride at the end.  Could not win anything.  Even my best hands ended up split pot, until my final table.

$4 bb…I get an AK so of course I go all in.  I get 1 caller and I get 2 more K’s on the draw to beat his pocket 10’s.  Whew.  I now have $120 in my stack.  Then on my last hand, I get an AK suited.  I almost did not want to go all in given my bad luck all night, but I follow the rules and go for it.  One guy folds and says ‘it is tiring folding after the stupid ass betting in front of me.’  Then, the next guy calls me, the same one from the last hand.

The cards come out as 7,6,A,A,A.  Sweet!

He had pocket queens but my 4 aces beat his full house for a big win!  I then left the table to a comment of ‘now he leaves’.  I ended down on the night with -$80.  So those last few hands saved my ass.

Such drama!  I love it.”

A couple of things impressed me about this email: First, he didn’t get superstitious like most people and allow his previous bad luck to make him risk-averse or risk-seeking.  He knew that risk is not to be avoided or sought out, it is only to be weighed.  He trusted that the System worked and went all-in for that reason and that reason only.  The other thing that struck me is that he was happy to end the session down $80.  Poker is actually just one long session, but most people have a hard time calling it a day when they’re down.  They’re tempted to keep playing even after they’re tired, and maybe even increase the stakes in an effort to get even again.  The outcome shouldn’t really matter to you, just the quality of your decisions.

So is poker gambling?  It can be, but doesn’t have to be.  Played profitably, it’s more like an investment that can be relied on to eventually provide a positive return.  Is it a game of skill?  Most definitely.

The Surprising Mathematics of Poker

In the game of Texas Hold ‘Em, each player’s hand at showdown is composed of the best five cards out of seven: their initial two cards plus five community cards (cards shared by all of the other players).  You probably already know that AA (“pocket Aces”) is the best hand to start with, but what is the worst?  Many people say 7-2 offsuit, since it’s the lowest hand that, unlike 3-2 offsuit, has no potential to make a straight.  However, if you were offered a choice between the two hands in a heads-up situation, you’d pick 2-7, since it’s ahead (has the highest card) before any additional cards are dealt.  Poker calculators, like this one, show that 7-2 has a 55.87% chance of beating 3-2 if all five community cards are dealt out (with an 18.15% chance of a tie).  These probabilities are calculated by dealing out all possible future sets of 5-cards and tracking the results.

Now suppose I offered you this challenge: We can play heads-up poker (no-limit Texas Hold ‘Em), each selecting our own hand from one of three possible starting hands, and you get to pick your cards first.  I’ll even tell you my strategy ahead of time: it will be to go all-in, as soon as possible, every hand.  The three hands to choose from are:

(1) A pair of 2s, (2) Jack-Ten suited, or (3) Ace-King offsuit

Which hand would you pick?

At first, AK looks good, since it’s considered one of the top starting hands in general.  However, even a pair as low as 22 wins 52.75% of the time vs AK, since it’s already a pair and the chances that an ace or a king shows up when the next five cards are dealt out is less than 50/50.  So, do you pick 22 as your starting hand?  If so, I would select Jack-Ten suited, which, thanks to possible flushes and straights, actually DOES have a better than 50/50 chance of improving to the winning hand (53.28% chance of winning vs. 22).  So, Jack-Ten suited must be the best hand?  Not so fast: AK has a 58.61% chance of beating Jack-Ten suited.  This is a non-transitive game!  Simply by choosing first, you will be at a disadvantage.

Here’s another surprising poker scenario that actually occurred during a tournament I played on a cruise.  I was very short on chips and was in the big blind (a forced bet, like an ante), which required me to put a third of my chips into the pot before even looking at my cards.  Everyone folded around to the guy next to me, who went all-in.  I looked down at my hand and it was one of the absolute worst: 8-2 offsuit.  Easy fold right?

Believe it or not, I should call and here’s why:  I had 1200 in chips before the hand and 400 of them went into the pot because of the blind bet.  That means that I had to decide whether or not to call 800 for a chance to double-up to 2400 (when an opponent goes all-in for more chips than you have in your stack, it’s the same as if he only bet the amount you have left).  When you look at it that way, it becomes clear than any chances of winning over 33% will make me a profit in the long run.  Suppose someone were offering $1 lottery tickets that win 40% of the time and had a prize of $3?  You’d buy as many tickets as you could get your hands on, even though the odds are against winning.  It’s the expected profit of $0.20 per ticket ($3 prize * 40% chance = $1.20 on average) that compels you to “gamble” in this case.

It turns out that if you assume my opponent was going all-in with a random hand here, I actually have about a 34% chance of winning.  When I called, he kicked himself for not realized that I was so short-stacked that he didn’t have any fold equity (value in bluffing).  I caught him with a measly 4-3, but he ended up winning and busting me out anyway.

This is an example of being “pot committed”, which means that it was profitable to call even though I was almost certain to have the worst hand.  There are times when this concept can be used to your advantage.  Suppose you have $90 at a table where the blinds are $5/$10.  Someone raises to $30 and the action gets to you and you decide to go all-in with AK.  If everyone else folds and the action gets back to the original raiser, he has to decide whether to call $60 for a chance at a $195 pot (small blind of $5 + big blind of $10 + his original raise of $30 + your all-in of $90 + another $60 if he decides to call).  He only needs a $60 / $195 = 30.8% of winning in order to break-even.  Suppose he had a 2-3 offsuit and you showed him your AK.  He’d still have over a 34% chance of winning and should therefore call!  Congratulations, you just got someone to call your all-in with a worse hand than yours, which is good for you.

The very fact that you were low on chips gave you an exploitable opportunity.  Since anyone who raises should go through the same mathematical reasoning as above and come to the conclusion that they have to call you, all you need to do is figure out when you have a better hand and collect your money.  It may be impossible to know that for any particular hand, but you can ensure that your all-in is expected to be profitable.  Online poker allows you to download the “hand history” from the games you play in.  If there’s any data wonk living within you, you would realize that digging through those files would give you a good sample of the range of hands that people normally raise with.  All you need after that is the handy poker calculator above and the patience to identify which potential hands would beat that range on average.  This is precisely the kind of analysis I did to come up with a very profitable “short-stack” strategy for online poker.

It turns out that in the situation above, AQ, AK, and all pairs 7 or higher are profitable for your all-in move.  Surprisingly, the range of profitable all-in hands increases to include a pair of sixes at the $10/$20 big blind level, since the original raisers get more creative and have a wider range of hands that they would get stuck calling with.  The moral to the story is that while many players focus on “tells” and “feel”, math geeks can and do find profitable situations by simply crunching the numbers.  Bad luck will always occasionally strike, but, as a Swedish proverb states, “luck doesn’t give, it only lends.”

By the way, for those interested in how my man vs. machine match against PokerSnowie turned out, see the end of my man vs. machine blog entry here.

catdealfaster

Picking Mutual Funds – Why Past Performance Doesn’t Matter

So you’ve decided to invest in mutual funds and you’ve narrowed down the list to some promising candidates.  You’ve got your Morningstar ratings handy and you’ve got past performance charts.  What can go wrong?

Well, there’s one big problem: there’s basically no evidence that better performing fund managers aren’t just getting lucky.  A study by Barras, Scaillet, and Wermers estimated that only 0.6% of over 2000 actively managed domestic equity funds actually demonstrated that skill was involved their long-term performance.  Even that number wasn’t statistically significant, so the study could not rule out the possibility that absolutely no one knows how to beat the S&P.  Since you’re all experts in regression to the mean now, you know exactly what to expect in the future from a fund whose past returns were entirely due to luck.  You may as well pick a fund at random, or better yet, just pick the one with the lowest expense ratio, like an index fund.  Actively managed funds appear to be charging for expertise that is primarily (entirely?) an illusion!

So if there’s no skill involved, why does it always look like there are so many mutual funds with great track records?  It’s basically survival of the luckiest.  The funds that are doing the worst are the most likely to get killed off, so when you’re only shown the survivors, you end up seeing what the victims of that stock-picking mail scam got to see: a history of hits with no visibility into the number of misses.

By the way, past performance shouldn’t cause you to hold onto stocks, either.  Many people don’t want to sell stocks that have gone down since they purchased them, reasoning that they’ll eventually go back up and make a profit.  A good way to find out if you actually believe the stock is still a good investment, ask yourself “if I didn’t own this stock right now, would I buy it?”  If the answer is no, you should recognize that by not selling it, you are effectively doing just that.  Whatever happened in the past is a sunk cost; you would either prefer to have the money or the stock.

There’s another problem that occurs when you judge investments only on their historical returns.  You may find a hedge fund, for example, with huge and stable returns every year and not have any idea that this is coming…

LTCM

That’s what it would have looked like if you had put $1000 into the top Long-Term Capital Management hedge fund in 1994.  If you think that kind of disaster looks like it couldn’t just be the result of good luck finally running out, you’re right; it has to do with financial leverage.

To demonstrate how the illusion of stability can be created through the use of leverage, consider the following simulation I created in Excel assuming a $10k initial investment and nothing better than a coin-flip’s chance at predicting the future.  After 13 years, I had demonstrated a completely stable 20% return every year!  You’d definitely want in on this fund, right?

Year 1 20%  $        12,000
Year 2 20%  $        14,400
Year 3 20%  $        17,280
Year 4 20%  $        20,736
Year 5 20%  $        24,883
Year 6 20%  $        29,860
Year 7 20%  $        35,832
Year 8 20%  $        42,998
Year 9 20%  $        51,598
Year 10 20%  $        61,917
Year 11 20%  $        74,301
Year 12 20%  $        89,161
Year 13 20%  $      106,993

You can probably guess that in year 14, it went completely broke.  Behind the scenes, I was just following a Martingale strategy where I bet 20% of the money on a coin-flip and, if it didn’t work out, I’d double the size of the bet on another coin flip to make up for it.  If that didn’t work out either, I still had 40% of the money left to try to get lucky and recover.  If at any point I’d made the right pick and got to a 20% profit, I’d call it a day and wait until the next year to repeat the process.  As long as I keep my proprietary trading strategy under lock and key (because it’s obviously so valuable), who’s going to know?

Okay, so forget trying to judge the quality of funds for yourself based on their history, how about using Morningstar ratings instead?  Well, it turns out, that would also usually be worse than if you just minimized the expense ratio.

“The star rating is a grade on past performance. It’s an achievement test, not an aptitude test…We never claim that they predict the future.”

Don Phillips, President of Fund Research at Morningstar

At this point, you might be comforting yourself with the fact that you have a financial advisor who knows all of this and can dodge the pitfalls for you and recommend great investments.  Unfortunately, unless you are one of the few people who uses a “fee only” advisor, there are probably some serious conflicts of interest that may have transformed your advisor into a salesman.  He or she may be quietly extracting commissions of up to 8% for selling you stuff with costs hidden in places you are unlikely to discover.

The moral to the story is: forget about trying to predict the market.  Get a “fee only” advisor to help you diversify broadly (into investments with low expense ratios, of course) and with an appropriate amount of risk for your situation, and don’t forget to re-balance every once in awhile.  And while you’re at it, quit trying to time the market as well; the time to sell is when you need the money and the time to buy is when you have the money.  Get rich slowly.