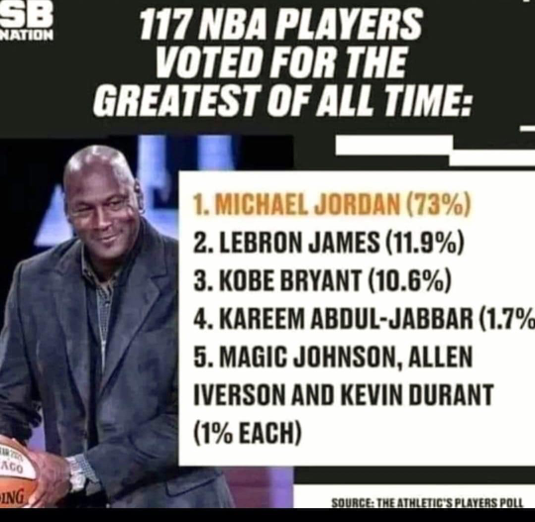
Despite the fact that LeBron James has now scored more total points than anyone in the history of the NBA, it appears that a consensus has been reached that his longevity and consistent greatness has never quite reached the Michael Jordan level. Recently, Jordan’s rookie card has skyrocketed in value, the MVP trophy has been redesigned in his likeness, and the majority of players asked have given him the nod, usually mentioning his playoff dominance (including two three-peats as champion and six Finals MVPs) or the intimidation factor his opponents experienced, playing against someone who was simultaneously the league’s best offensive player as well as the best defensive player.
However, as a data scientist, I can’t help but wonder how you’d rank players in a completely objective way. What if you just measured players based on their average performance during the regular season over their careers? They say there’s no “I” in team, but certainly the best player have collected all of the points, assists, rebounds, steals, and blocks that they could. Maybe calling it a ranking of the “best” players is too much, but you could certainly argue that it would be an interesting list of the most “productive” players. Would ranking players this way create a list similar to ESPN’s recent ranking of the 74 best players of all time or would it be completely different?
Unfortunately, I could only find complete data back to 1973 (NBA.com only had data back to 1996(?!)), so I missed Kareem Abdul-Jabbar’s first four seasons. However, I do have all of the stats necessary to compare LeBron and MJ and rank them among all of the players who had careers in the last 50 years. I know they say you can’t compare players across eras, but we’re going to do it anyway…
And yes, I know that more players averaged over 30 points per game this season than any season since the 1960s. When measuring productivity, it seems that with the modern higher-paced game, statistics would be easier to come by. I considered controlling for that, but I’m not so sure that it’s fair. What if modern-day players are generally just better than players were 20 years ago? My approach is: when in doubt, just keep it simple. It’s always okay to add asterisks later if something looks weird.
One last thing: in addition to adding up all of the points, assists, rebounds, blocks, and steals for every season played (“Total Production”), I also divided that by the number of games played in each season (for lack of a better name for the stat, let’s call it “Fantasy Points per Game”) and also by the number of minutes played (“Fantasy Points per Minute”). This will give us a few different ways to compare players. Total Production would favor durable players, FPPG would take durability out of it and measure what players do when they’re healthy, while FPPM would benefit players who may not play a lot, but definitely filled the stats sheets while they were on the floor.
Before we get to the “most productive players” list, there were quite a few interesting Top 10 lists that you may have never seen…
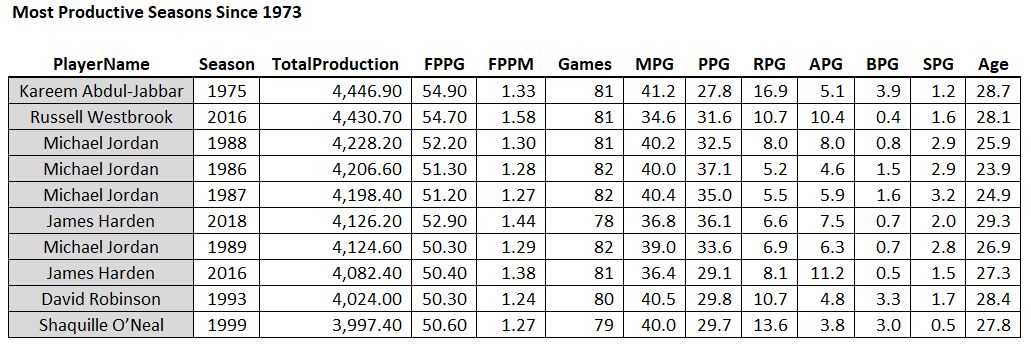 Some guy named Michael Jordan had 4 of the top 10 seasons of all time.
First thing to note is that Kareem of 1975 was a beast: 28 points, 17 rebounds, 5 assists, and 4 blocks per game, and played 81 out of the 82 possible games. And #2 all-time goes to Russell Westbrook’s massive triple double season in 2016. Then there’s a lot of Michael Jordan. Notice that he’s the only player who played all 82 games on this list and he did it three times. Except for his broken foot season, the guy just wouldn’t take a day off (except for baseball, sigh).
Hey, while we’re here, let’s take a little trip through history and see who was the most productive player (MPP) each season for the last 50 years…
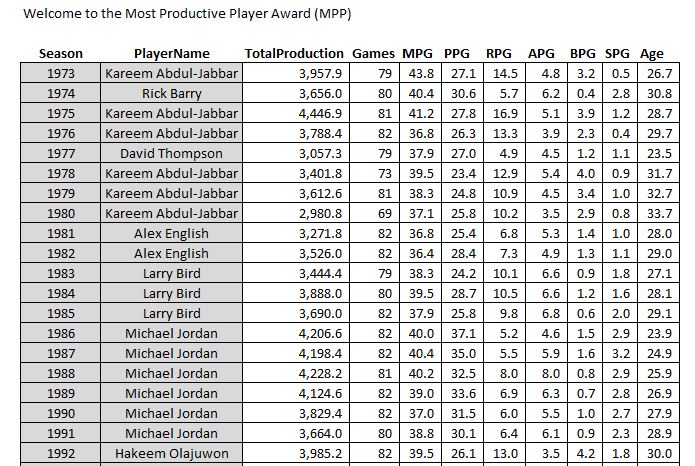 The first 20 seasons in my dataset
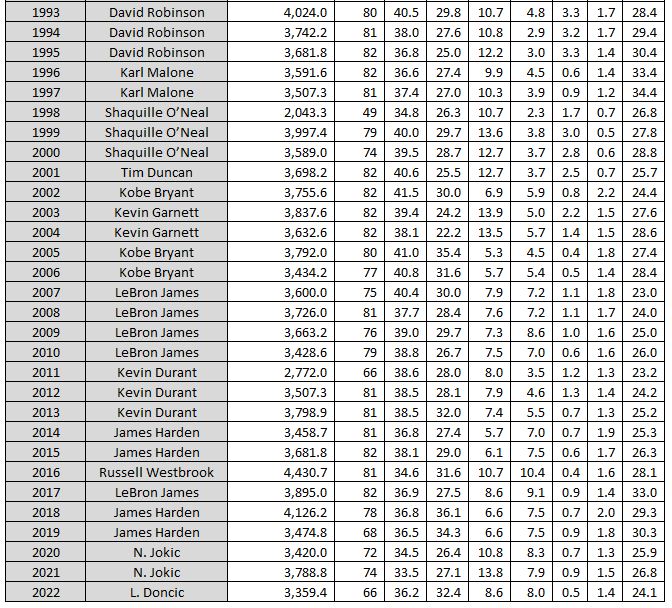 And the last 30. Congrats Luka on your first MPP this year!
Shouldn’t this be an award?
In the last 50 years, these would be the top recipients of the MPP trophy:
Michael Jordan: 6
Kareem Abdul-Jabbar: 6
LeBron James: 5
James Harden(!): 4
Kobe Bryant: 3
Shaquille O’Neal: 3
Kevin Durant: 3
Larry Bird: 3
David Robinson: 3
Not a bad list. It’s interesting to see that Jordan’s statistical reign of terror was when he 24-29 (at which point the big men took over the productivity title) and when he was 28, his championship reign of terror began and he won the NBA Finals in his next six complete seasons (stretching over 8 years because of the baseball hiatus). This might be the strongest argument for his GOAT status: For a stretch of a dozen straight years, MJ was either the statistically most productive NBA player or the leader of the championship team (or off playing baseball, sigh).
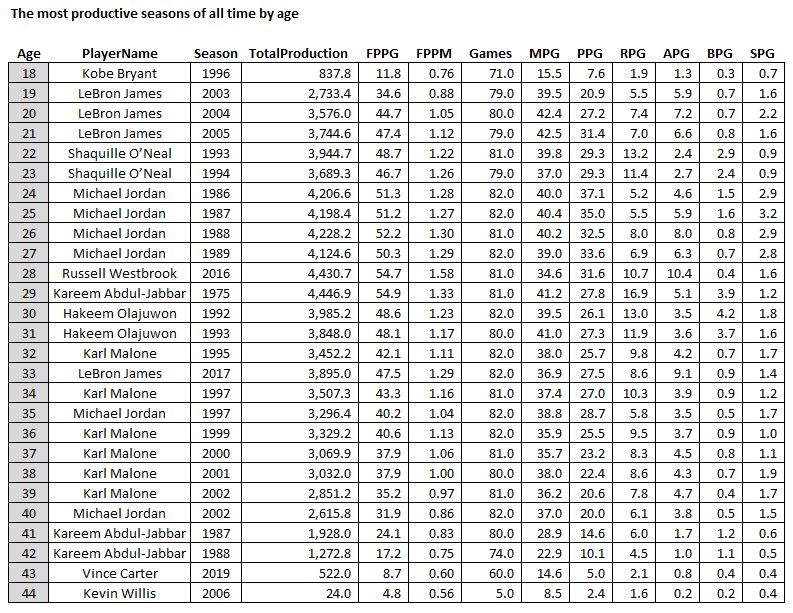
Another interesting “most productive of all-time” list is to compare by age, from the most productive 18-year-old (Kobe) to the most productive 44-year-old (Kevin Willis, who played 5 games and averaged a whopping 2.4 points per game, this game is not kind to “old” players!)…
The Most Productive Seasons of the Last 50 Years by Age
 Does Kevin Willis know he’s an all-time great 44 year old?
Look at that TotalProduction column. It ramps up to a peak at 28-29 years old and then it’s “over the hill” in terms of nba productivity! No 30 year old in history has surpassed 4000 total stats (although LeBron fought father time and got close at age 33). Also surprising is to see Karl Malone own the ages 36-39, where I would think LeBron would take over the list. The key is the Games column: Karl pretty much played ALL the games and was just as durable and age-resistant as LBJ.
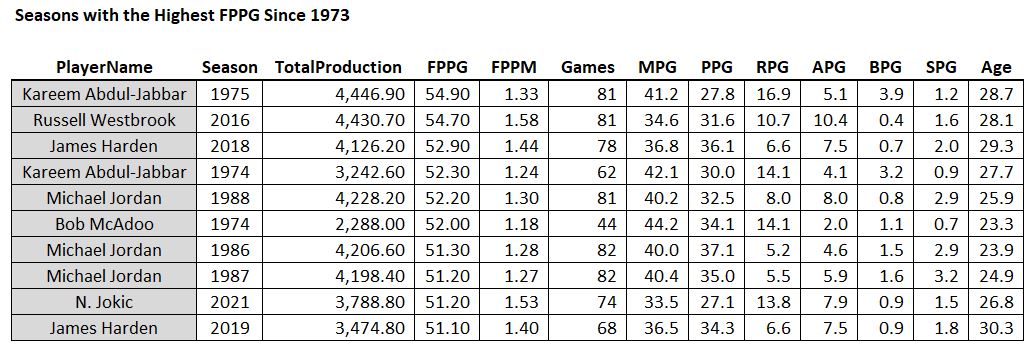
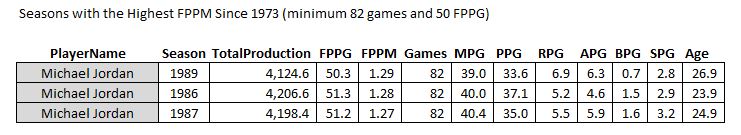
The top seasons of the last 50 years in terms of FPPG…
 A couple recent seasons sneak into the list
Bob McAdoo, there’s a name from the past! He only played half the season, but I wonder how he feels being sandwiched between Michael Jordan and Michael Jordan? The guy was a badass: scored 34 points and collected 14 rebounds per game that season! Also, we see a couple more recent seasons in the list, which might help explain how so many players can be averaging 30 points per game these days: “Load Management”. If it’s true that teams are resting their stars more than they used to (and it appears that way), then it looks like the idea of ranking players based on total production during a season instead of per game statistics won’t give the modern player the boost we’d expect based on the higher scoring averages.
For completeness, here are the TOP FPPM seasons in the last 50 years…
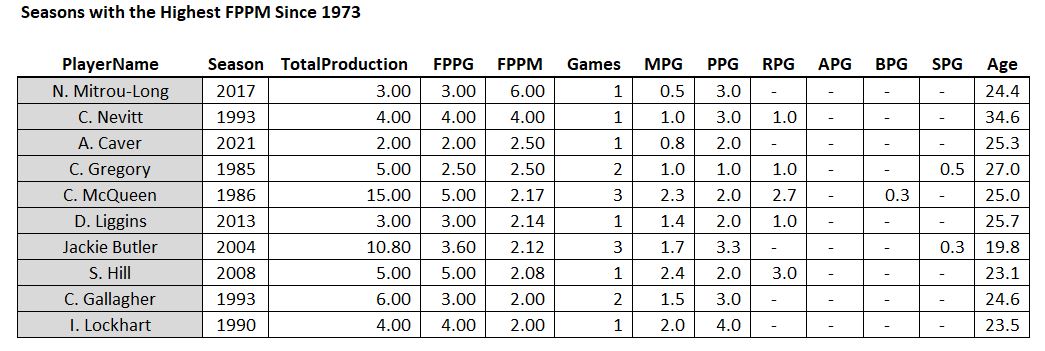 Just kidding! The statistical pitfall of small sample size in all of its glory – Mr. Mitrou-Long played 30 seconds and got three points. Best season ever!
 How about a minimum of 10 games?
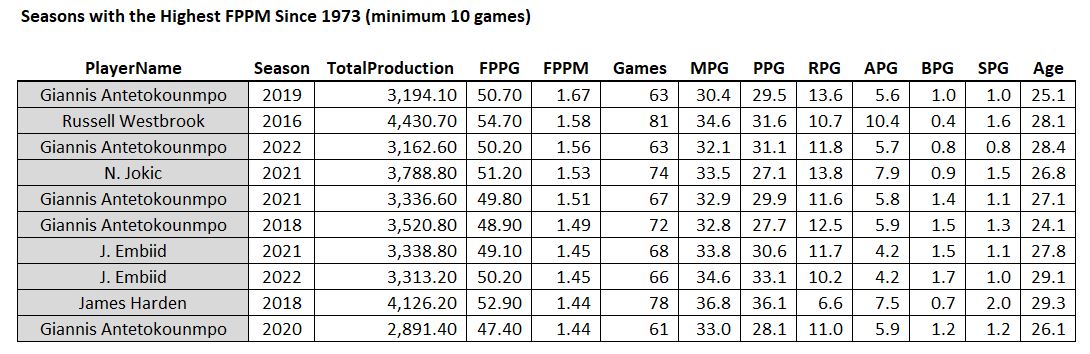 Greek Freak! And all recent seasons (half of the list is in the last two seasons)!
So THIS is what the game has evolved towards. No seasons are on this list before 2016. It looks like the modern approach is: play 85% of the games and play 70% of the minutes so you can just go full throttle. Each of the Greek Freak’s last 5 seasons is on the list of the 10 most productive seasons per minute since 1973. We should probably just rename the stat “GF” in his honor.
And I’m assuming this would be the “MJ” stat…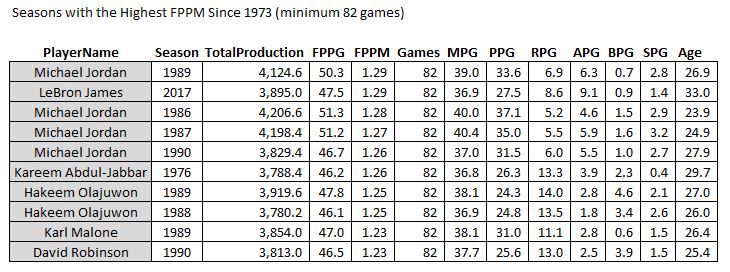 Pretty much.
Wow, if it weren’t for the fact that it’s based on one season, that’s a pretty good looking GOAT list right there. These are the players with the highest output per minute, who also played every single game in a season. I suppose if you want an exclusive MJ list, you could just do this…
 But this is data-mining (don’t tell Gary Smith on me)
Anyway, without further ado, here’s the list of the top 50 players, ranked by their career average productivity per season. Note: there are some partial careers here (like Kareem) and players currently active (like LeBron and Luka) who can rise or fall in this list in the future.
The Top Average Productivity Ranking (Last 50 Years)
| Rank | Player Name | Avg Season |
| 1 | Michael Jordan | 3,201 |
| 2 | Karl Malone | 3,179 |
| 3 | LeBron James | 3,149 |
| 4 | L. Doncic | 3,013 |
| 5 | Kareem Abdul-Jabbar* | 2,968 |
| 6 | N. Jokic | 2,929 |
| 7 | Russell Westbrook | 2,915 |
| 8 | Larry Bird | 2,856 |
| 9 | Giannis Antetokounmpo | 2,829 |
| 10 | James Harden | 2,816 |
| 11 | Trae Young | 2,793 |
| 12 | Magic Johnson | 2,776 |
| 13 | Hakeem Olajuwon | 2,762 |
| 14 | David Robinson | 2,719 |
| 15 | Charles Barkley | 2,694 |
| 16 | Kevin Durant | 2,685 |
| 17 | Tim Duncan | 2,625 |
| 18 | Damian Lillard | 2,616 |
| 19 | Dominique Wilkins | 2,568 |
| 20 | Allen Iverson | 2,538 |
| 21 | Shaquille O’Neal | 2,536 |
| 22 | Isiah Thomas | 2,534 |
| 23 | Clyde Drexler | 2,529 |
| 24 | J. Tatum | 2,527 |
| 25 | K. Towns | 2,525 |
| 26 | D. Issel | 2,519 |
| 27 | Patrick Ewing | 2,511 |
| 28 | J. Embiid | 2,500 |
| 29 | Kobe Bryant | 2,478 |
| 30 | Julius Erving** | 2,445 |
| 31 | J. Randle | 2,440 |
| 32 | Alex English | 2,439 |
| 33 | A. Edwards | 2,429 |
| 34 | Anthony Davis | 2,426 |
| 35 | Donovan Mitchell | 2,399 |
| 36 | Kevin Garnett | 2,386 |
| 37 | Stephen Curry | 2,373 |
| 38 | Dirk Nowitzki | 2,344 |
| 39 | Rick Barry | 2,331 |
| 40 | B. Daugherty | 2,308 |
| 41 | Chris Paul | 2,304 |
| 42 | P. Banchero | 2,297 |
| 43 | Gary Payton | 2,283 |
| 44 | John Stockton | 2,273 |
| 45 | Antoine Walker | 2,271 |
| 46 | Dwyane Wade | 2,269 |
| 47 | D. DeRozan | 2,264 |
| 48 | D. Booker | 2,239 |
| 49 | J. Morant | 2,228 |
| 50 | N. Vucevic | 2,198 |
*Kareem’s first four years were better than his average years, so his true productivity average based on known statistics would be a little over 3075. However, steals and blocks weren’t tracked over 50 years ago, so you could argue that he missed #1 here based on a technicality!
**I also just peeked at Dr. J’s lifetime statistics and his average total productivity, including his ABA years, actually puts him above Michael Jordan! However, there’s big asterisk: in three of his four ABA years, he played 84 games, which isn’t possible in the NBA. If you prorate his stats down for those years to 82 games, he drops into the #2 slot below Michael. Then again, they didn’t count steals and blocks in 1971… it never ends!
I looked at this list a month ago and LeBron was #2, so his injury-shortened season this year dropped him down a slot. If he can stay healthy, I expect him to regain that #2 slot next year. And look at Luka Magic and Jokic! Jokic is closing in on that “over the hill” age and can be expected to start drifting down the list in a few years, but Luka is only 24 years old! Considering the season he just had, he may be starting his own reign of terror in the league right now.
If we were looking at the complete set of historical NBA stats, Wilt Chamberlain would almost certainly be the regular season productivity GOAT. I have a friend who’s constantly pushing the “Wilt is GOAT” narrative online. Rather than argue with him about championships and stuff, I usually respond with “I have eyes”. If you’ll open your mind to subjective arguments for a second, pretend you’re an NBA scout and that Wilt’s highlight reel actually came from a college prospect you were thinking about drafting:
Be honest. How skilled does he look and how skilled do his opponents look?
For comparison, here’s a highlight reel from a single game from Victor Wembanyama a couple weeks ago…
Wemby highlight reel (one game)
The game has clearly changed, and modern players are much more skilled than the average player 50+ years ago. Evidently the “economics of pro basketball exploded” in the 1970’s, so it’s hardly surprising that the quality and skill of the average athlete would explode as well. You can argue Wilt was the most “dominant” player of all time. But not GOAT.
Anyway, I digress.
For the “LeBron is GOAT” people out there, here’s the list you want to see: top players by TOTAL productivity.
The Iron Men of the NBA (last 50 years)…
| Rank | PlayerName | Lifetime Productivity |
| 1 | LeBron James | 62,974 |
| 2 | Karl Malone | 60,408 |
| 3 | Kevin Garnett | 50,114 |
| 4 | Tim Duncan | 49,871 |
| 5 | Hakeem Olajuwon | 49,719 |
| 6 | Kobe Bryant | 49,566 |
| 7 | Dirk Nowitzki | 49,216 |
| 8 | Shaquille O’Neal | 48,186 |
| 9 | Michael Jordan | 48,012 |
| 10 | Kareem Abdul-Jabbar* | 47,491 |
| 11 | Russell Westbrook | 43,730 |
| 12 | John Stockton | 43,184 |
| 13 | Charles Barkley | 43,101 |
| 14 | Patrick Ewing | 42,679 |
| 15 | Jason Kidd | 41,503 |
| 16 | Chris Paul | 41,478 |
| 17 | Carmelo Anthony | 41,411 |
| 18 | Paul Pierce | 41,143 |
| 19 | Kevin Durant | 40,281 |
| 20 | Robert Parish | 39,863 |
| 21 | Vince Carter | 39,445 |
| 22 | James Harden | 39,426 |
| 23 | D. Howard | 39,089 |
| 24 | Gary Payton | 38,805 |
| 25 | Pau Gasol | 38,690 |
| 26 | Dominique Wilkins | 38,526 |
| 27 | David Robinson | 38,063 |
| 28 | Clyde Drexler | 37,937 |
| 29 | Moses Malone | 37,392 |
| 30 | Larry Bird | 37,126 |
| 31 | Alex English | 36,590 |
| 32 | Dwyane Wade | 36,306 |
| 33 | Magic Johnson | 36,089 |
| 34 | Scottie Pippen | 35,841 |
| 35 | Ray Allen | 35,824 |
| 36 | Allen Iverson | 35,535 |
| 37 | Reggie Miller | 35,391 |
| 38 | L. Aldridge | 33,315 |
| 39 | Buck Williams | 33,107 |
| 40 | S. Marion | 32,978 |
| 41 | Isiah Thomas | 32,939 |
| 42 | Steve Nash | 32,393 |
| 43 | Kevin Willis | 32,190 |
| 44 | O. Thorpe | 32,069 |
| 45 | Z. Randolph | 31,966 |
| 46 | T. Cummings | 31,905 |
| 47 | Joe Johnson | 31,807 |
| 48 | Clifford Robinson | 31,778 |
| 49 | D. DeRozan | 31,690 |
| 50 | A. Jamison | 31,391 |
*Actually, when adding Kareem’s missing first four years, even his known statistics would put him at the top here with 65,854. So LeBron needs another year or two before he can safely say that there is no asterisk and that he’s definitely the all-time total productivity leader of the NBA.
Maybe this is the way you rank the players, but I don’t think people generally agree with that. Actually, we can quantify how close these lists approximate what people think of as the GOAT by looking at the correlation between these lists and the ESPN list (the gaps in the ESPN list below are players who didn’t play in the last 50 years).
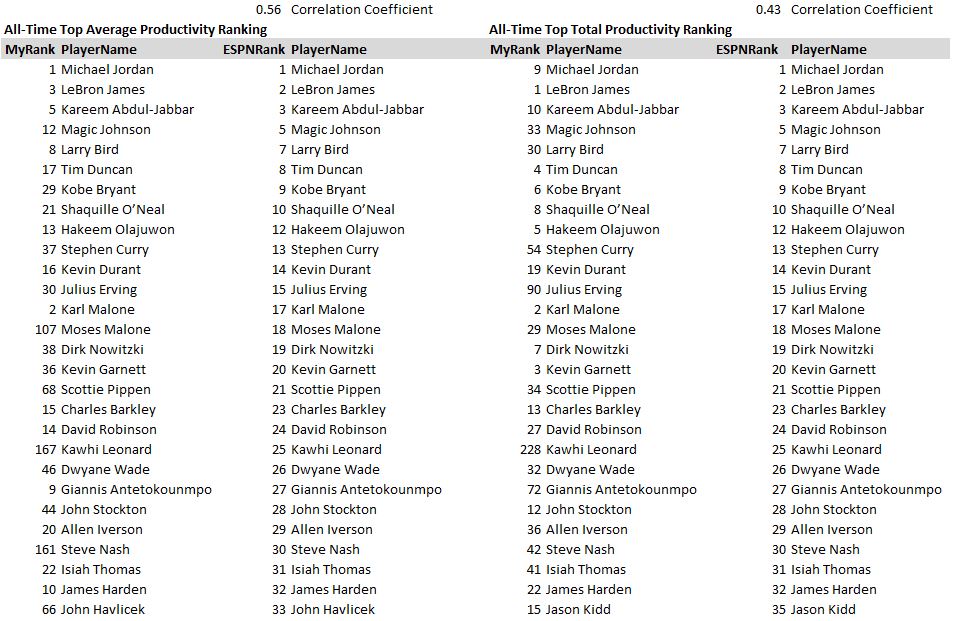 Side-by-Side Comparison with ESPN’s list (in ESPN order)
So a few takeaways here:
(1) The Average Productivity list correlates better with the ESPN list (0.56 correlation > 0.43 correlation), which makes sense. People usually think of basketball as a sprint, not a marathon.
(2) Karl Malone is #2 on both my lists and #17 on the ESPN list. Is he underrated? Statistically, I suppose so, but I also know why ESPN has him lower than you’d expect. I remember the experience of watching him play. Let’s just say that the hardest all-time record LeBron to break may be Malone’s free throw record. Basically, he found a stats-hack and rode that puppy for years. Not entertaining, but effective, I’ll give him that. It’s also possible that ESPN penalized him for his trademark hand behind the head dunk.
(3) My ranking is not kind to players who have a lot of injury-shortened seasons. I’m actually a little surprised Jordan comes out on top in spite of two very short seasons: broken foot and returning from baseball. Those two seasons brought his average down a lot and don’t forget that he even played for the Wizards at age 40! Other players with a handful of injury seasons like Moses Malone get thrown far down the list.
(4) Kawhi Leonard! ESPN has him at #25 and I’ve got him at #167. What’s going on there? This is clearly a case where winning rings is highly respected in the sports community, but they’re not reflected in the regular season statistics my number-crunching is focused on. In the case of Steve Nash, MVP trophies carry a lot of weight in the ESPN rankings as well.
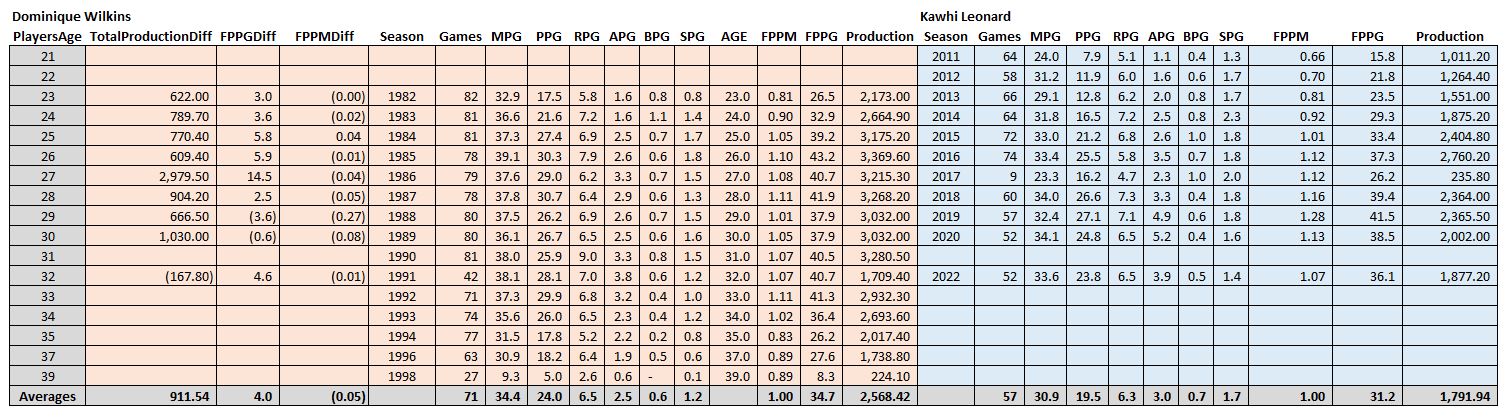
(5) As I look down the list for underrated players, it’s mostly players who are currently playing and may regress towards the ends of their careers. However, there are a few exceptions worth noting: Dominique Wilkins (my rank = 19, ESPN rank = 46), Clyde Drexler (my rank = 23, ESPN rank = 57), and Alex English (my rank = 32, ESPN rank = 67). These guys seem to have filled up the stat sheet much more than ESPN recognizes. Here’s a comparison between Dominique Wilkins (ESPN rank 46) and Kawhi Leonard (ESPN rank 25)…
 Too small to read, click here!
It’ll probably take a second to make sense of what I did here. I joined Dominique’s career stats with Kawhi’s career stats by age. For example, how did 23-year-old ‘Nique compare with Kawhi at 23? If you look at the PlayersAge column and find 23, you’ll see that Dominique had 17.5 ppg, 5.8 rpg, 1.6 apg, while Kawhi had 12.8 ppg, 6.2 rpg, and 2 apg. In terms of my summary statistics, they were dead even in terms of stats per minute. However, Dominique played 4 minutes more per game on average, so his stats per game was higher. And he played 16 more games (the full 82), so his total productivity is much higher (+622).
It turns out that this same pattern pretty much holds for every year in common between the two players. The only year in which Kawhi had higher total productivity was when they were both 32, Dominique played only 42 games and put 168 fewer points on the stat sheet than Kawhi. Over their careers on average, the players are even per minute, but Dominque is +912 in total annual productivity. Basically, Dominque = Kawhi + minutes + games. My list doesn’t consider championships, so it’s like “where’s the love for ‘Nique and Drexler?”
Let’s be honest though, you’re not reading this blog to see the comparison of Dominque vs. Kawhi. It’s this one…
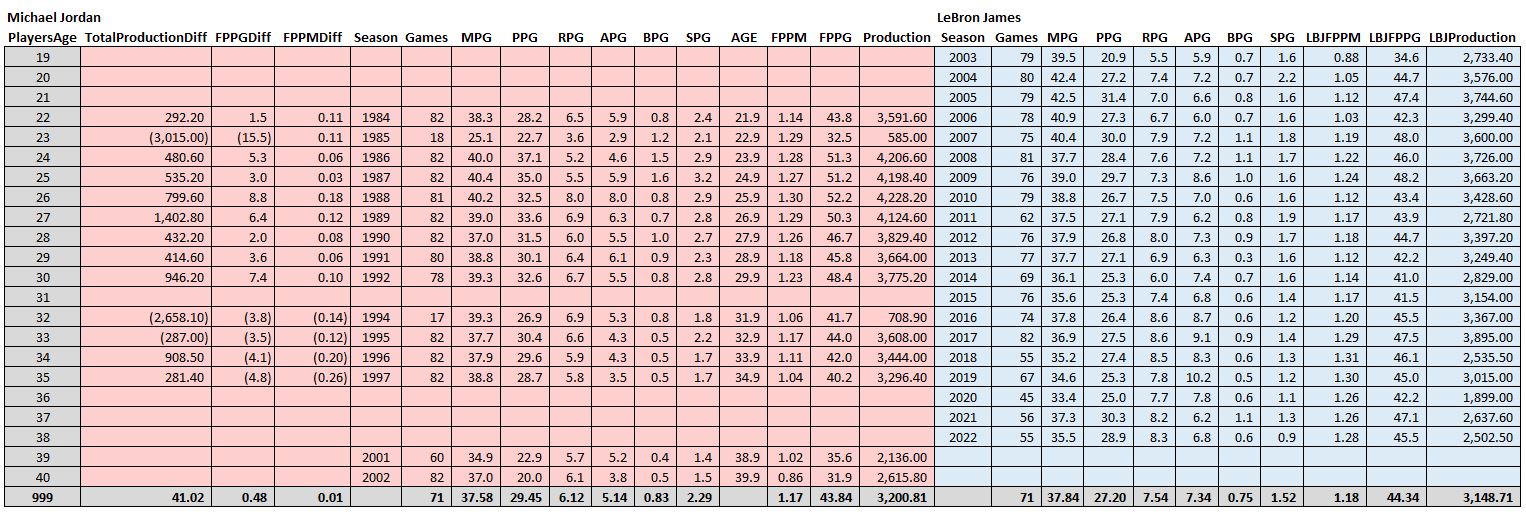 Who’s more productive, MJ or LeBron?
In terms of overall averages, there’s actually not a lot of statistical daylight between these two! However, LeBron made up huge chunks of his productivity deficit in two years: (1) when they were 23, MJ broke his foot and played limited minutes in 18 games and (2) when they were 32, MJ came back for the last 17 games of the season in “baseball shape.”
However, it’s fair to say that in terms of total productivity, Jordan gets the clear nod. In the 13 ages they played in common, MJ was more productive in 9 of them. The only other season LeBron was more productive than MJ was the year after the baseball return. So you could say that MJ went 10-3 against LeBron in a head-to-head productivity competition.
However, there is something for LeBron fans here. Notice the FPPM and FPPG statistics. There is a significant difference between BB (“before baseball”) and AB (“after baseball”). MJ beat LeBron in both of these stats in every single season BB (except for the broken foot season when there was a cap on MJ’s minutes, much to his frustration). However, LeBron has been beating MJ in both of these stats every single season AB. The only reason Jordan comes out ahead in overall productivity after baseball is because he played 82 games per season. After baseball, Michael transitioned a bit from Air Jordan to Chill Jordan, but still came to play every game. That said, kudos to LeBron for coming to work every single season.
It’ll be interesting to see if LeBron can keep it up and outperform MJ’s Washington Wizard years. In particular, Jordan’s final year at 40 years old was pretty remarkable: 82 games played with 20 ppg, 6.1 rpg, and 3.8 apg. In fact, it puts him on top of this list, which you’ve probably never seen:
The most productive final years in the last 50 years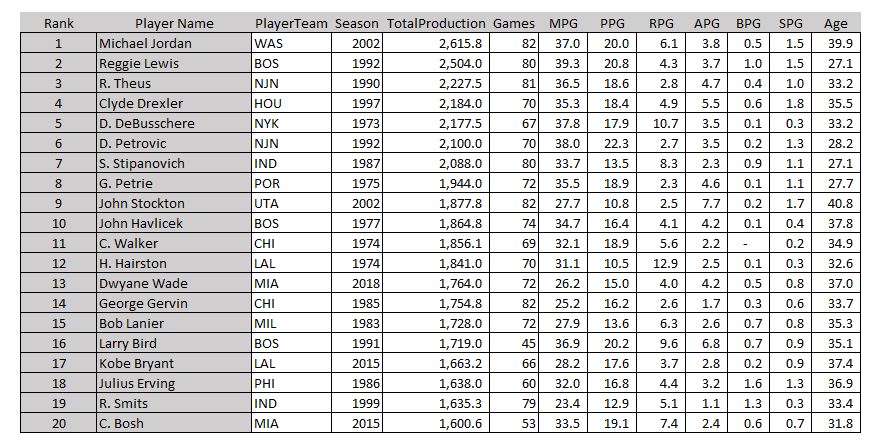 This could be called the “why did they retire again?” list
These guys left the game with their heads held high. As a kid I remember being pretty upset about Dr. J retiring, thinking “this guy is still great, why is he leaving?” It’s rare for a star to be able to swallow their pride like Vince Carter did and try to push their rickety 40-year-old bodies to keep up with the young guns.
For symmetry, here are the most productive rookie seasons of the last 50 years…
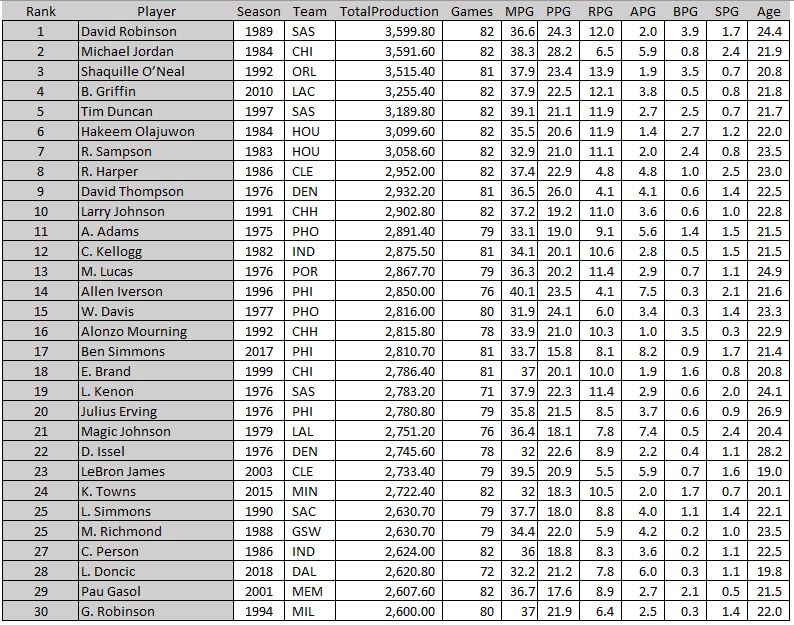 A lot of familiar names here
David Robinson spoiled Jordan’s potential “best first year and best last year” flex. He came into the league as a 24-year-old after his active duty in the Navy was complete, ready to dominate. He even surpassed his idol Ralph Sampson’s first year stats (Sampson is the reason Robinson wore the #50). Also of note, Dr. J’s “first year” here is his NBA rookie year. He was in the ABA from 1971-1976.
I’ve probably worn you guys out with the endless stats here, but I’ve got a couple last good ones for you. I like the idea above of head-to-head comparisons “by age”, so a question came to mind. What if I compare ESPN’s top players to each other in a round-robin tournament in which all of them matched up against every other one and I calculated their “productive season win %” (recall that MJ had a 10/13 = 77% win rate against LeBron – it’s in the list below).
Match-up results…
| PlayerName1 | PlayerName2 | Win Percentage |
| Kareem Abdul-Jabbar | Kobe Bryant | 72.73 |
| Kareem Abdul-Jabbar | Larry Bird | 77.78 |
| Kareem Abdul-Jabbar | LeBron James | 66.67 |
| Kareem Abdul-Jabbar | Magic Johnson | 83.33 |
| Kareem Abdul-Jabbar | Michael Jordan | 50.00 |
| Kareem Abdul-Jabbar | Shaquille O’Neal | 84.62 |
| Kareem Abdul-Jabbar | Tim Duncan | 92.86 |
| Kobe Bryant | Kareem Abdul-Jabbar | 27.27 |
| Kobe Bryant | Larry Bird | 38.46 |
| Kobe Bryant | LeBron James | 31.58 |
| Kobe Bryant | Magic Johnson | 46.15 |
| Kobe Bryant | Michael Jordan | 15.38 |
| Kobe Bryant | Shaquille O’Neal | 41.18 |
| Kobe Bryant | Tim Duncan | 50.00 |
| Larry Bird | Kareem Abdul-Jabbar | 22.22 |
| Larry Bird | Kobe Bryant | 61.54 |
| Larry Bird | LeBron James | 38.46 |
| Larry Bird | Magic Johnson | 77.78 |
| Larry Bird | Michael Jordan | 25.00 |
| Larry Bird | Shaquille O’Neal | 76.92 |
| Larry Bird | Tim Duncan | 46.15 |
| LeBron James | Kareem Abdul-Jabbar | 33.33 |
| LeBron James | Kobe Bryant | 68.42 |
| LeBron James | Larry Bird | 61.54 |
| LeBron James | Magic Johnson | 69.23 |
| LeBron James | Michael Jordan | 23.08 |
| LeBron James | Shaquille O’Neal | 72.22 |
| LeBron James | Tim Duncan | 76.47 |
| Magic Johnson | Kareem Abdul-Jabbar | 16.67 |
| Magic Johnson | Kobe Bryant | 53.85 |
| Magic Johnson | Larry Bird | 22.22 |
| Magic Johnson | LeBron James | 30.77 |
| Magic Johnson | Michael Jordan | 11.11 |
| Magic Johnson | Shaquille O’Neal | 50.00 |
| Magic Johnson | Tim Duncan | 45.45 |
| Michael Jordan | Kareem Abdul-Jabbar | 50.00 |
| Michael Jordan | Kobe Bryant | 84.62 |
| Michael Jordan | Larry Bird | 75.00 |
| Michael Jordan | LeBron James | 76.92 |
| Michael Jordan | Magic Johnson | 88.89 |
| Michael Jordan | Shaquille O’Neal | 71.43 |
| Michael Jordan | Tim Duncan | 80.00 |
| Shaquille O’Neal | Kareem Abdul-Jabbar | 15.38 |
| Shaquille O’Neal | Kobe Bryant | 58.82 |
| Shaquille O’Neal | Larry Bird | 23.08 |
| Shaquille O’Neal | LeBron James | 27.78 |
| Shaquille O’Neal | Magic Johnson | 50.00 |
| Shaquille O’Neal | Michael Jordan | 28.57 |
| Shaquille O’Neal | Tim Duncan | 38.89 |
| Tim Duncan | Kareem Abdul-Jabbar | 7.14 |
| Tim Duncan | Kobe Bryant | 50.00 |
| Tim Duncan | Larry Bird | 53.85 |
| Tim Duncan | LeBron James | 23.53 |
| Tim Duncan | Magic Johnson | 54.55 |
| Tim Duncan | Michael Jordan | 20.00 |
| Tim Duncan | Shaquille O’Neal | 61.11 |
Which can be summarized neatly like this…
| Player Name | Avg Win % |
| Kareem Abdul-Jabbar | 75.43 |
| Michael Jordan | 75.27 |
| LeBron James | 57.76 |
| Larry Bird | 49.73 |
| Tim Duncan | 38.60 |
| Kobe Bryant | 35.72 |
| Shaquille O’Neal | 34.65 |
| Magic Johnson | 32.87 |
Kareem and Michael are in a virtual tie for first place in this “tournament.” Keep in mind that each of these players is matching up against other players only for the ages they both played, so this is a complicated statistic to calculate. In fact, for the SQL geeks out there, enjoy the gory details behind this query at the bottom of this article.
One last thing. For those of you curious what such a “round-robin tournament” list would look like right now with some of today’s stars, you’re welcome…
| Player Name | Avg Win % |
| LeBron James | 81.80 |
| Giannis Antetokounmpo | 59.85 |
| Kevin Durant | 59.47 |
| K. Towns | 56.81 |
| N. Jokic | 55.79 |
| L. Doncic | 52.14 |
| James Harden | 51.99 |
| Russell Westbrook | 51.69 |
| L. Ball | 50.00 |
| Damian Lillard | 47.50 |
| Trae Young | 47.22 |
| J. Morant | 44.79 |
| Anthony Davis | 42.80 |
| Stephen Curry | 41.24 |
| J. Embiid | 36.62 |
| K. Irving | 23.05 |
Okay, enough already with the stats overload. Go take a nap! (And let me know what I overlooked and need to include in my next blog).
– J
“The SQL Query”…
| –TotalProduction Summarized!………………………………… | ||||
| WITH Players AS ( | ||||
| SELECT * FROM nba WHERE PlayerName IN (‘Kareem Abdul-Jabbar’, ‘Larry Bird’, ‘Kobe Bryant’, ‘Magic Johnson’, ‘Michael Jordan’, ‘Shaquille O’Neal’, ‘Tim Duncan’, ‘LeBron James’) | ||||
| ), | ||||
| PlayerCombinations AS ( | ||||
| SELECT | ||||
| P1.PlayerName AS PlayerName1, | ||||
| P2.PlayerName AS PlayerName2, | ||||
| P1.Age AS Age1, | ||||
| P2.Age AS Age2, | ||||
| P1.TotalProduction – P2.TotalProduction AS TotalProductionDiff | ||||
| FROM | ||||
| Players P1 | ||||
| CROSS JOIN Players P2 | ||||
| WHERE | ||||
| P1.PlayerName <> P2.PlayerName | ||||
| AND ROUND(P1.Age, 0) = ROUND(P2.Age, 0) | ||||
| ), | ||||
| WinCount AS ( | ||||
| SELECT PlayerName1, PlayerName2, COUNT(*) AS Wins | ||||
| FROM PlayerCombinations | ||||
| WHERE TotalProductionDiff > 0 | ||||
| GROUP BY PlayerName1, PlayerName2 | ||||
| ), | ||||
| LossCount AS ( | ||||
| SELECT PlayerName1, PlayerName2, COUNT(*) AS Losses | ||||
| FROM PlayerCombinations | ||||
| WHERE TotalProductionDiff < 0 | ||||
| GROUP BY PlayerName1, PlayerName2 | ||||
| ), | ||||
| TotalCount AS ( | ||||
| SELECT | ||||
| W.PlayerName1, | ||||
| W.PlayerName2, | ||||
| W.Wins, | ||||
| L.Losses, | ||||
| W.Wins + L.Losses AS Total | ||||
| FROM | ||||
| WinCount W | ||||
| INNER JOIN LossCount L ON W.PlayerName1 = L.PlayerName1 AND W.PlayerName2 = L.PlayerName2 | ||||
| ), | ||||
| AllWins as ( | ||||
| SELECT | ||||
| PlayerName1, | ||||
| PlayerName2, | ||||
| Wins * 100.0 / Total AS WinPercentage | ||||
| FROM | ||||
| TotalCount | ||||
| ) | ||||
| SELECT PlayerName1, avg(Winpercentage) | ||||
| FROM AllWins | ||||
| GROUP BY PlayerName1 | ||||
| ORDER BY avg(Winpercentage) DESC; | ||||