You may have heard that, contrary to conventional wisdom, most research discredits the idea that NBA players can get “hot”(see here and here). Researchers say that sequences of made baskets occur just as often as you’d expect if they each shot was completely independent. I have always been skeptical of this conclusion, but other than nit-picking the way the studies analyzed the data (for example, not accounting for varying levels of defense or time elapsed between shots), I couldn’t think of a way to statistically demonstrate it. I felt that best way to measure hot streaks would probably be to analyze the 3-point-shooting contest, which takes most of the other variables out of the equation, but how could there possibly be a large enough sample size to demonstrate that a player’s shooting percentage is a less accurate predictor of a shot’s success rate than the result of the prior few shots?
Then, I read Economist Gary Smith‘s upcoming book, Lucky – The Surprising Role of Luck in Our Everyday Lives (keep an eye open for it this year – it’s great), and saw an argument that considered the length of the longest streaks of made baskets in relation to the total shots taken. In my mind, this was the missing tool I’d been waiting for. We have a record of all NBA participants in the 3 point contest (on sites like this) and we have a list of the longest streaks of made shots (see this one on Wikipedia). So we’re set!
Before we get to the data crunching, here’s a little background: once a year, the best 3-point shooters in the NBA are invited to compete against each other for the title of 3-point contest champion. The way the contest works is that the players take turns trying to make as many shots as they can out of 25 (from 5 different spots behind the 3-point line) in one minute. There have been slight variations in the rules over the years regarding “money balls” that are worth 2 points each, but for the purpose of this analysis, we’ll consider only the makes vs. the misses.
The first thing we need to know is the general shooting percentage for the competitors. Historical data shows that the competitors average about 51% of the best possible score, so that’s what I’m considering the baseline percentage. Since there’s not a huge discrepancy between the shooting percentages of the top players, I simplified the problem by treating them all as if they are the same player, with a shooting percentage that’s indistinguishable from a coin-flip.
Here’s how we can determine whether or not hot streaks exist: suppose they don’t exist. This means that the series of makes and misses from these contests should be indistinguishable from a series of people flipping coins against each other. That’s because coin flips are known to be independent events and have streaks that are only due to luck, and not a “hot hand.” If it turns out that I can tell you how to look at a string of 1s and 0s and determine whether it represents baskets or coin flips, then the baskets must not be independent events.
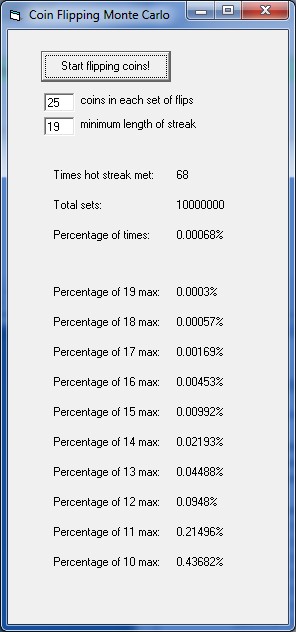
Well, there have been almost 350 competitors over the years, so the first question I had was: if 350 people were flipping sets of 25 coins, how often would we see a streak of heads like this. Yes, that happened; Craig Hodges drained 19 in a row in 1991. The math gets a little hairy with the principal of inclusion / exclusion considerations, so I was more comfortable writing a small computer program to simulate 10,000,000 sets of coin flips (Monte Carlo method) and keep track of the longest streaks. Here’s what I got…

Streaks of at least 19 heads occurred 68 times out of 10 million. So that means that my friend Mr. Carlo would put the probability that we’d only see a Craig Hodges of coin-flippers 0.00068% of the time, even if we had 350 cracks at it. This was pretty strong evidence for the existence of a hot streak (at least for one man), but I wasn’t totally comfortable with the conclusion yet. The second longest streak was only 13 makes in a row (Stephen Curry this year), and based on the simulation, a streak of that length wouldn’t be an outlandish result after all these years, happening almost a third of the time.
Here were the average number of occurrences of each streak length per 350 sets (25 flips for each set)…
19 heads – 0.00
18 heads – 0.00
17 heads – 0.01
16 heads – 0.02
15 heads – 0.03
14 heads – 0.08
13 heads – 0.16
12 heads – 0.33
11 heads – 0.75
10 heads – 1.53
It didn’t sit well with me that the evidence for hot streaks seemingly rested on one supernatural accomplishment, so I looked for another way to spot the “hot hand” in the data. Instead of just looking at the longest streak, what if we considered the total number of very long streaks? Based on the data above, we’d expect 2.91 players on average to have streaks of at least 10 by now. Well, it turns out that we have seven…
| Player | Shots | Season |
|---|---|---|
| Craig Hodges | 19 shots | 1991 |
| Stephen Curry | 13 shots | 2015 |
| Larry Bird | 11 shots | 1986 |
| Hubert Davis | 11 shots | 1996 |
| Kyrie Irving | 10 shots | 2013 |
| Jason Kapono | 10 shots | 2008 |
| Ray Allen | 10 shots | 2011 |
This seems pretty strong; we’ve seen more than twice as many streaks of 10 or more than we’d expect from flipping coins. But how unlikely is it?
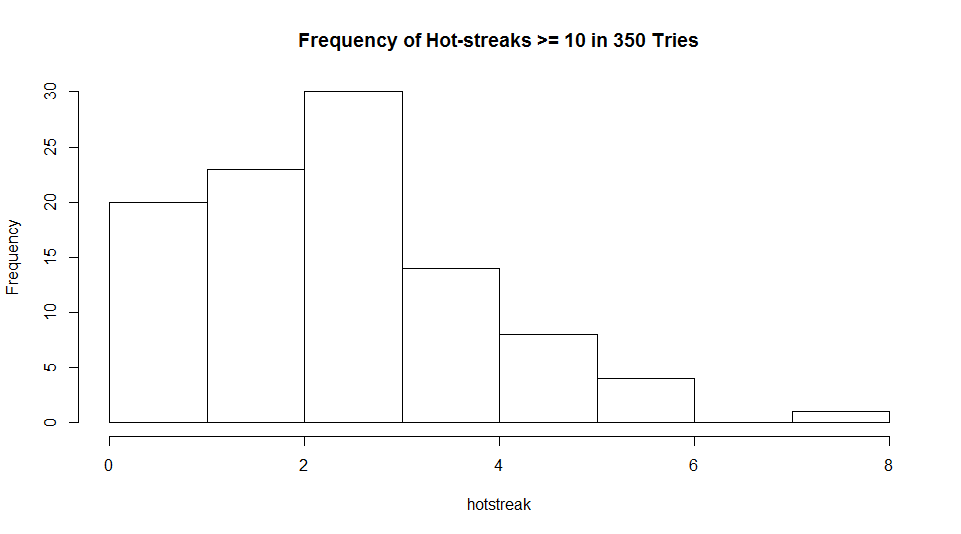
I had my friend Mr. Carlo run 100 alternate histories of 350 sets in which NBA players flipped coins instead of shooting baskets and here’s what I got…
Well, I think this is enough to call it. If hot streaks are imaginary, seeing 7 players out of 350 hit at least 10 in a row would only occur about once in 100 times. So, the next time you hear someone complaining about how stupid people are to think that streaks exist, like this guy, ask him the last time he saw someone flip 19 heads in a row. Or 77 in a row.
